
Morning Star
Patterns · Candlestick Patterns
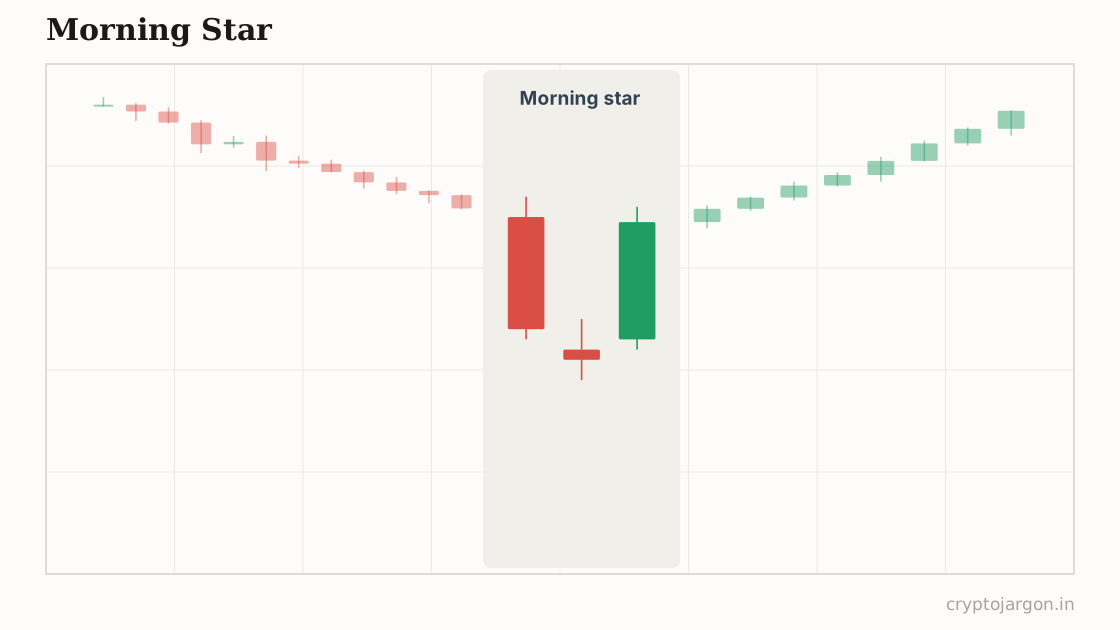
A morning star is a three-candle bullish reversal pattern: a long red candle, a small-bodied candle stalling at the lows, then a strong green candle closing well into the first candle's body. It appears after a downtrend and is supposed to signal that selling pressure has exhausted and buyers are taking control.
"Sellers threw their best punch at the lows, gassed out, and buyers walked them straight backwards."
The structure
Three candles at the end of a decline. Candle one: a long red body, the downtrend still in charge. Candle two: a small body — a doji or spinning top, ideally no bigger than about a third of candle one's body — sitting at or below the first candle's close. Textbooks want a gap down, but crypto trades 24/7, so on BTC or ETH the 'star' usually just prints as a stall at the lows rather than a true gap. Candle three: a solid green body closing above the midpoint of candle one, ideally on volume clearly higher than the two candles before it. It means far more on the 4h and daily than on a 5-minute chart.
Whose orders make the shape
Candle one is trend-followers pressing and late shorts piling in. Candle two is the tell: sellers keep hitting the bid and price stops going down, which means someone is absorbing every market sell at the lows. Candle three is the unwind — shorts who entered on candle one are suddenly underwater, and as price closes back into that first red body their stops and breakeven covers become buy orders that fuel the very candle you're watching. It isn't magic; it's a visible record of sellers exhausting into resting bids and then getting squeezed.
The conventional trade plan
Convention says enter at the close of the third candle, or wait for a pullback toward its midpoint for a better price. Invalidation is a close below the low of the star candle — if that low goes, the reversal thesis is dead and you're out, no negotiating. The conventional target is the nearest prior resistance or swing high; some traders project the pattern's height upward instead. That's the textbook play, and its real value is that it defines your risk precisely.
The trap — what invalidates it. Everyone who buys a morning star parks their stop in the same place: just under the star's low. That makes the level a magnet. The classic move is a fourth-candle wick that sweeps below the pattern low, fills the stop cluster, and only then rallies — you were right on direction and still got tapped out. The other trap is context: a morning star printing mid-range in a strong downtrend is usually a pause, not a bottom. What confirms: genuine volume expansion on candle three, the low staying defended on a retest, and ideally signs of capitulation before the pattern formed. What merely tempts: a pretty three-candle shape on thin weekend volume.
What the evidence says
Systematic tests of candlestick reversals are humbling: across large samples the edge is weak, inconsistent, and often gone after costs. Identification is subjective too — loosen the definition and morning stars appear everywhere, tighten it and you get a handful a year. The clean examples in textbooks are survivors picked after the fact.
Tested on our data?
Not this one — it needs a human-drawn line, and a pattern that two traders would draw two different ways can't be backtested honestly. We test the mechanical ones and say so, rather than inventing a number.
Morning and evening stars on closed candles, in the scanner
Related
Part of the pattern library — every pattern with its trap, because the textbook version is the bait.
Crypto Jargon
Live numbers load with JavaScript and refresh every few minutes; the text above is the page at build time.