
Evening Star
Patterns · Candlestick Patterns
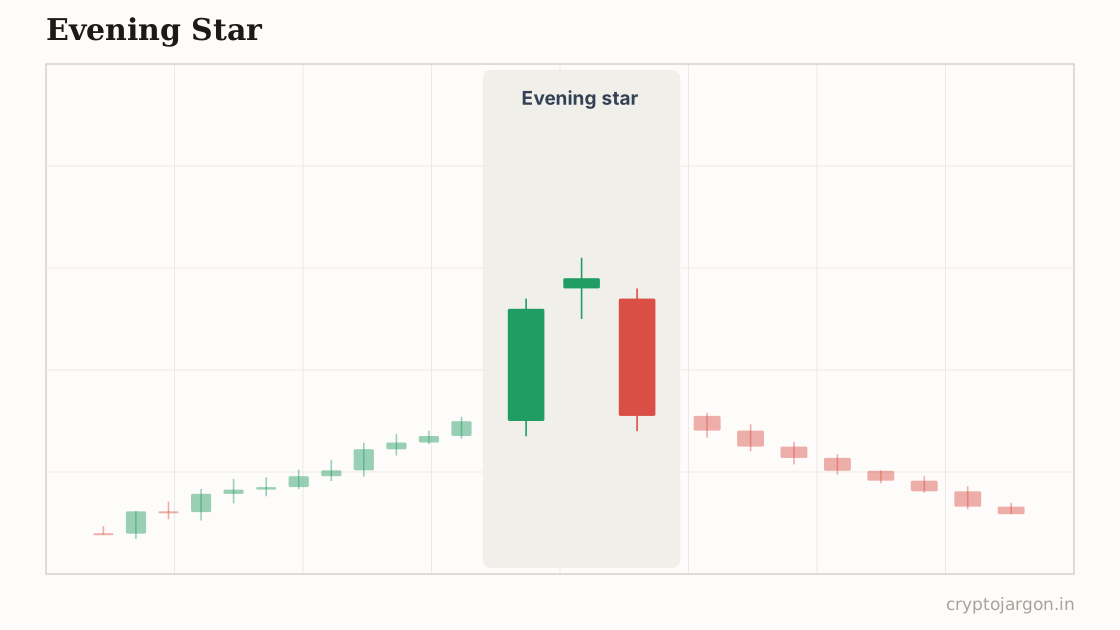
An evening star is a three-candle bearish reversal pattern: a strong green candle, a small-bodied candle stalling near the highs, then a long red candle closing deep into the first candle's body. It forms after an uptrend and is supposed to signal buyer exhaustion and the start of a move down.
"The candle where someone hands their bags to the last guy still bidding the top."
The structure
Three candles at the top of a run. Candle one: a long green body, trend intact. Candle two: a small body — doji or spinning top — printing at or above the first candle's close; that's the stall. Textbooks want a gap up, but crypto's 24/7 tape means you'll rarely see one on majors — thin alts sometimes substitute a violent upper wick instead. Candle three: a heavy red body closing below the midpoint of candle one, ideally on expanding volume. It carries the most weight after an extended move on the 4h or daily, especially into a known resistance level.
Whose orders make the shape
Candle one is late longs chasing strength and shorts covering. Candle two is the tell: buyers keep lifting offers and price stops going up, which means someone with size is unloading into that demand — distribution in a single candle. Candle three springs the trap: every long who bought the last two candles is underwater, and as price cuts back into the first body their stops become market sells that accelerate the drop. In perp-heavy crypto markets, stretched positive funding into the pattern adds fuel — a crowded long side makes the down-candle nastier.
The conventional trade plan
The convention: short at the close of the third candle, or on a weak bounce back toward its midpoint. Invalidation is a close above the star's high — above that, the sellers you were betting on clearly aren't in control, so you're out. Target is the nearest prior support or the pattern's height projected downward. That's the standard playbook, not a promise; its honest value is telling you exactly where you're wrong.
The trap — what invalidates it. The stop cluster sits just above the star's high, and the market knows it. The signature trap is a wick that pokes above the pattern high — stopping out early shorts and baiting breakout buyers — right before the real flush. Short the textbook entry and you can be right and still pay. Also beware evening stars printing mid-uptrend at no particular level; those are usually pauses that trend-followers eat alive. What confirms: candle three closing on rising volume, a lower high on the retest, funding still crowded long. What merely tempts: one red candle drifting into obvious support with nothing behind it.
What the evidence says
Large-sample candlestick studies generally find bearish three-candle reversals barely better than chance once you demand strict definitions and account for fees. Context does most of the work the pattern gets credit for. The textbook charts are curated survivors.
Tested on our data?
Not this one — it needs a human-drawn line, and a pattern that two traders would draw two different ways can't be backtested honestly. We test the mechanical ones and say so, rather than inventing a number.
Morning and evening stars on closed candles, in the scanner
Related
Part of the pattern library — every pattern with its trap, because the textbook version is the bait.
Crypto Jargon
Live numbers load with JavaScript and refresh every few minutes; the text above is the page at build time.