
Shooting Star
Patterns · Candlestick Patterns
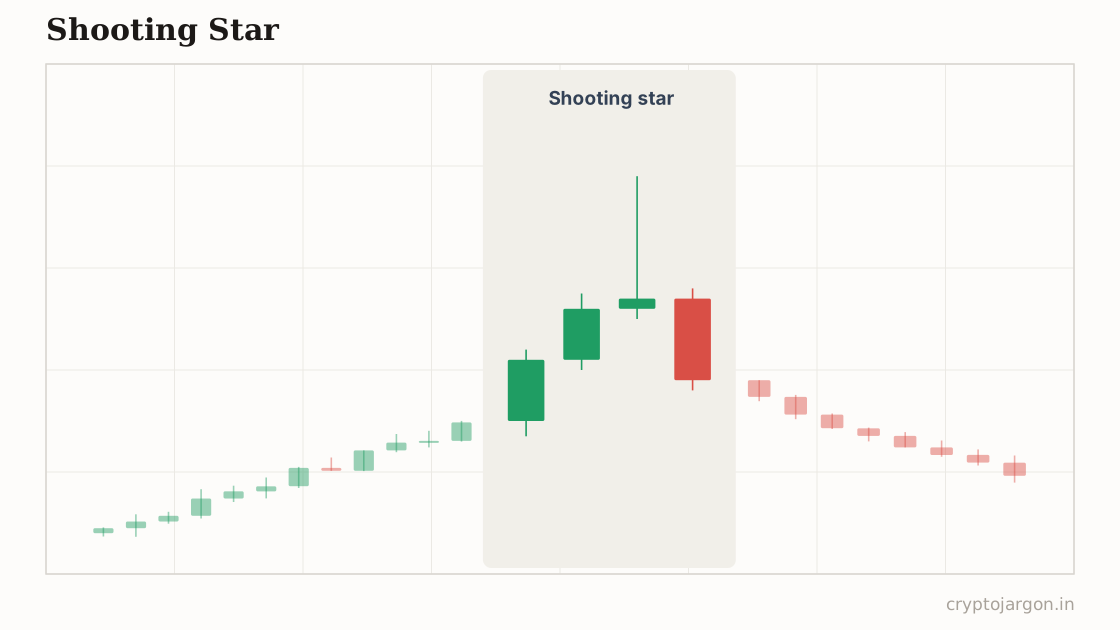
A shooting star is a single candle with a small body near the bottom and an upper wick at least twice the body's length, printed after a rally. The wick shows buyers drove price up and sellers slammed it back down, and it is supposed to mark a top.
"Price popped up to collect everyone's breakout orders, said thanks, and left."
The structure
One candle after a rally: a small body sitting at the bottom of the range, an upper wick at least twice the body's height, minimal lower wick. The meaningful version prints into a level — a prior high, a round number, the top of a range where an alt's breakout attempt gets sold on the 4h. Volume sharpens the read: a big-wick candle on heavy volume means real business changed hands up there; a wispy wick on nothing is a weekend-tape artifact.
Whose orders make the shape
The upper wick is breakout buyers and short stops being run into someone's resting offers. Buy-stops above the old high trigger, late longs chase, and a seller with size fills their exit into all of it — then the buying dries up and price falls back through the wick. Everyone who bought the top third of that wick is trapped, and their capitulation later becomes fuel for the down move. It's a stop hunt above a high, printed as one candle.
The conventional trade plan
Convention: short at the star's close, or on a weak bounce that fails to reclaim the body. Invalidation is a close above the wick high — if price gets back above the level where all that selling happened, the sellers lost. Target is the prior support or the base of the last leg up. As always, that's the convention, not a promise; the pattern marks where supply showed up once.
The trap — what invalidates it. Two traps live here. First, strong uptrends print shooting stars constantly and keep climbing — shorting every upper wick in a trending market is a donation schedule. Second, the star's high is now the obvious short-stop cluster, so a second poke above it that squeezes the fresh shorts before any drop is standard practice. What confirms: the star printing after a sweep of a well-watched high, a follow-through red candle, longs' open interest unwinding. What tempts: one wick, mid-trend, with no level behind it and funding still sane.
What the evidence says
In systematic testing, single-candle reversal shapes like this show weak and inconsistent predictive power — sensitive to the market and period tested, and mostly not worth trading standalone after costs. Chart threads only show you the stars that topped. The wick tells you sellers were there once; it doesn't tell you they're coming back.
Tested on our data
543 instances · 48 coins · 4h candles · 2026-01-24 → 2026-10-01 · detection on closed candles, entry next open, vs a 200-round shuffled control
- Hit rate, ~2 days out (vs random entries)
- 54.1% vs 52%
- Hit rate, ~5 days out
- 54.2% vs 52.4%
- Average move in the claimed direction (~2d)
- -0.94%
Statistically indistinguishable from random entries in this window — treat the structure as a map of stops, not a signal.
Shooting stars on closed candles, in the scanner
Related
Part of the pattern library — every pattern with its trap, because the textbook version is the bait.
Crypto Jargon
Live numbers load with JavaScript and refresh every few minutes; the text above is the page at build time.