
Bearish Engulfing
Patterns · Candlestick Patterns
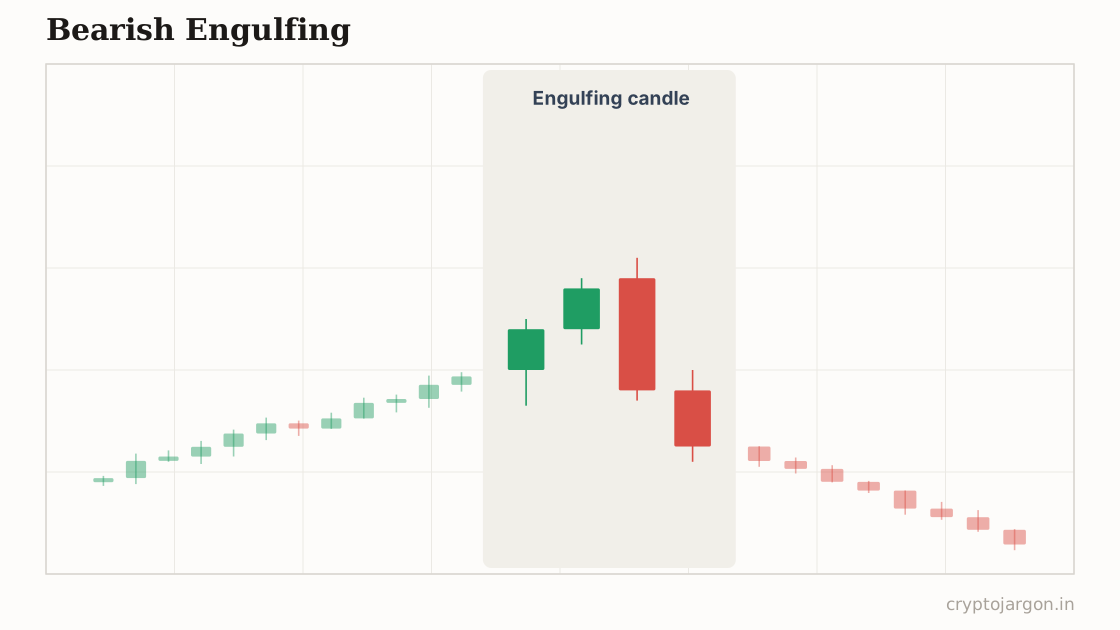
A bearish engulfing is a two-candle pattern where a red candle's real body completely covers the previous green candle's body, appearing after a rally. It is read as sellers overwhelming buyers in one session, trapping everyone who bought the green candle, and it is supposed to signal a short-term top or downward reversal.
"One red candle swallows the green one, and every late long is suddenly checking where their stop is."
The structure
Two candles after an advance: the first green, the second red, opening at or above the first candle's close and closing below the first candle's open, so the red body fully covers the green one. It matters most into a level — a bearish engulf on an alt's 4h right at a prior high says more than one floating mid-range. Volume expansion on the red candle is the tell you want; a mild drift lower that technically engulfs on half the volume is bookkeeping, not distribution.
Whose orders make the shape
The green candle is late longs chasing strength — buying because it's going up. The engulf prints when someone with size uses that buying to unload: offers absorb the market buys, then push price back through the entire prior body. Every one of those late longs closes the session at a loss, with their stops sitting in one visible place below the pattern. It's really a snapshot of distribution — demand walked into supply and lost.
The conventional trade plan
Convention: short at the engulfing candle's close, or wait for a weak bounce into its midpoint. Invalidation is a close back above the engulfing candle's high — if price reclaims the whole pattern, the sellers didn't follow through and now you're the trapped one. Target is the prior support or the origin of the up-leg. Standard playbook, stated as convention: the pattern locates a fight, it doesn't decide the winner.
The trap — what invalidates it. The engulf's high is where every short parks their stop, so expect it to get poked — a sweep above the high that squeezes shorts out, then the real drop, is the version that actually pays, and retail is usually stopped out before it starts. Flip side: a bearish engulf at the bottom of a range tempts you into shorting straight into resting bids, which is donating. What confirms: the pattern at a prior high or after a sweep of one, a lower high on the bounce, a follow-through red candle. What tempts: a single scary candle in an uptrend that's still making higher lows.
What the evidence says
Systematic studies of reversal candles like this generally find weak, inconsistent results — sometimes a mild edge on some timeframes, often nothing, rarely anything robust after costs. The clean examples in textbooks are curated after the fact. Where the candle prints matters far more than the fact that it printed.
Tested on our data
1,875 instances · 48 coins · 4h candles · 2026-01-24 → 2026-10-01 · detection on closed candles, entry next open, vs a 200-round shuffled control
- Hit rate, ~2 days out (vs random entries)
- 52.9% vs 52.2%
- Hit rate, ~5 days out
- 54% vs 53.1%
- Average move in the claimed direction (~2d)
- -0.8%
Statistically indistinguishable from random entries in this window — treat the structure as a map of stops, not a signal.
Engulfing candles on closed candles, in the scanner
Related
Part of the pattern library — every pattern with its trap, because the textbook version is the bait.
Crypto Jargon
Live numbers load with JavaScript and refresh every few minutes; the text above is the page at build time.