
Bullish Engulfing
Patterns · Candlestick Patterns
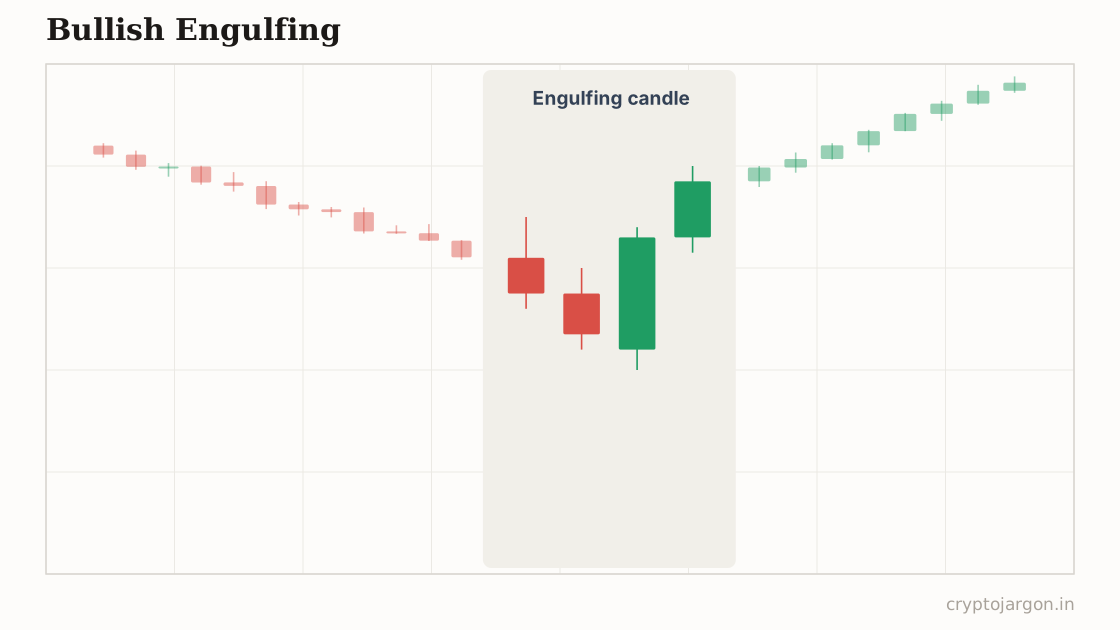
A bullish engulfing is a two-candle pattern where a green candle's real body completely covers the previous red candle's body, appearing after a decline. It is read as a sign that buyers have absorbed the selling and taken control, and it is supposed to signal a short-term bottom or upward reversal.
"One big green candle eats yesterday's red one, and suddenly everyone's a bottom-caller."
The structure
Two candles: the first is red, the second is green, opening at or below the first candle's close and closing above the first candle's open — body swallows body, wicks optional in most definitions. It means more after a multi-candle decline into a level people are actually watching, like BTC's daily printing one at a prior range low. Look for the engulfing candle's volume to run above the last few candles' average; a body engulf on dead volume is just a quiet day wearing a costume.
Whose orders make the shape
The first red candle is late sellers and stopped-out longs hitting market. The engulf happens when that selling exhausts into resting bids — in crypto, often right after a liquidation flush has cleared the leveraged longs out. With forced sellers gone, shorts covering plus fresh spot buying re-marks price through the whole prior body, which leaves everyone who sold during the red candle underwater at the close. That discomfort — trapped shorts, regretful sellers — is the fuel the pattern is betting on.
The conventional trade plan
Convention says: enter long at the engulfing candle's close, or wait for a retest of its midpoint for better price. Invalidation is a close below the engulfing candle's low — if price is back under the whole pattern, the buyers you were betting on didn't show. Target is usually the next resistance or the origin of the down-leg, scaling out on the way. That's the textbook plan, not a promise; the level does the work, the candle just times it.
The trap — what invalidates it. The engulfing candle's low is the most obvious stop cluster on the chart, and it gets swept — a bullish engulf followed by one sharp wick through its low that takes everyone out before the actual move is a routine trap. The other classic: a big green engulf that's really a funding squeeze, printed straight into overhead resistance with spot flow doing nothing — it tempts breakout buyers and dies at the level. What confirms: the next candle holding above the engulf's midpoint, the pattern printing at support that already got swept, spot-led buying. What merely tempts: one impressive green candle on its own.
What the evidence says
Tested systematically, engulfing patterns show at best small and unstable edges that vary by market and timeframe, and mostly fade after fees. Two analysts will also disagree on whether a given candle even 'counts', which tells you how soft the definition is. The context — trend, level, flow — carries far more weight than the candle.
Tested on our data
1,909 instances · 48 coins · 4h candles · 2026-01-24 → 2026-10-01 · detection on closed candles, entry next open, vs a 200-round shuffled control
- Hit rate, ~2 days out (vs random entries)
- 49.6% vs 47.4%
- Hit rate, ~5 days out
- 48.5% vs 46.8%
- Average move in the claimed direction (~2d)
- +0.38%
In this window it worked more often than random entries — one of the few that did.
Engulfing candles on closed candles, in the scanner
Related
Part of the pattern library — every pattern with its trap, because the textbook version is the bait.
Crypto Jargon
Live numbers load with JavaScript and refresh every few minutes; the text above is the page at build time.