
Hammer
Patterns · Candlestick Patterns
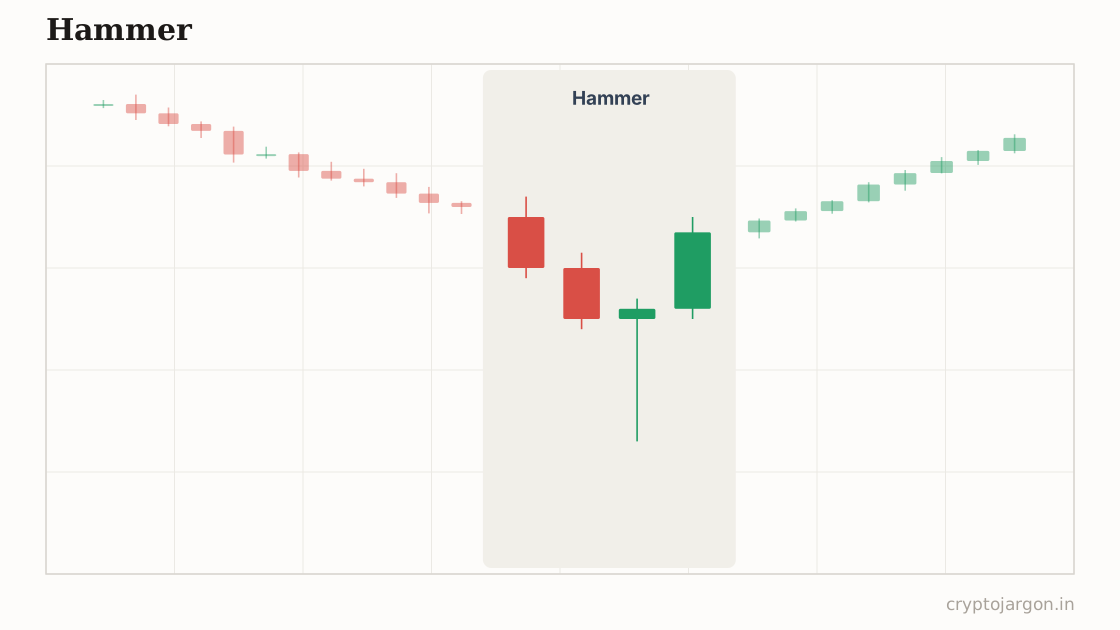
A hammer is a single candle with a small body near the top and a lower wick at least twice the body's length, printed after a decline. The long wick shows sellers pushed price down and buyers pushed it all the way back, and it is supposed to signal a bottom.
"The candle where someone dumped their whole bag and the bids ate every coin of it."
The structure
One candle: a small body parked in the top of the range, a lower wick at least twice the body's height, little to no upper wick, printed after a decline. Body colour matters less than location — a hammer into a prior swing low or a level the whole timeline has marked is the setup; a hammer floating mid-freefall is just a pause. In crypto these often print on the 1h or 4h at the bottom of a liquidation flush, where the wick is the cascade and the recovery is the bids surviving it.
Whose orders make the shape
That lower wick is an order-flow story: stops and liquidations fired off a run of forced market sells, price plunged into resting limit bids, the bids held, and with the forced sellers spent there was nobody left offering — so price snapped back up. Everyone who panic-sold or got liquidated in the wick now watches price close above their exit. A hammer is essentially a liquidity sweep drawn as a single candle, which is exactly why it's respected and exactly why it's imitated.
The conventional trade plan
Convention: long at the hammer's close, or on a retest of the body for a better entry. Invalidation is a move back below the hammer's wick low — if that low doesn't hold, the bids you were betting on are gone. Target is the origin of the drop or the first resistance overhead, taking partials on the way. Textbook plan, stated as convention: the wick shows you where buyers were, not that they'll show up twice.
The trap — what invalidates it. Everyone puts their stop just under the hammer's wick low, which makes it the most magnetic level on the chart — the second dip that sweeps those stops before the real bounce is so common it's practically a genre. The 'double bottom trap' is often exactly this: hammer, entries, stops loaded, sweep, then the move. The other trap is a hammer mid-cascade during live news — that wick isn't absorption, it's a brief pocket of exit liquidity. What confirms: the hammer at a level that already got swept, the next candle holding the body, open interest flushing out. What tempts: any long wick, anywhere, while the knife is still falling.
What the evidence says
Hammer-type candles have been tested to death, and the honest summary is mixed results, small effects, heavy dependence on trend filters and exit rules, and little that survives fees. The memorable examples are survivorship — failed hammers don't make it into threads. The wick is real order-flow information; the pattern name adds nothing to it.
Tested on our data
503 instances · 48 coins · 4h candles · 2026-01-24 → 2026-10-01 · detection on closed candles, entry next open, vs a 200-round shuffled control
- Hit rate, ~2 days out (vs random entries)
- 51.1% vs 47.3%
- Hit rate, ~5 days out
- 48.3% vs 46.5%
- Average move in the claimed direction (~2d)
- +0.48%
Statistically indistinguishable from random entries in this window — treat the structure as a map of stops, not a signal.
Hammers and hanging men on closed candles, in the scanner
Related
Part of the pattern library — every pattern with its trap, because the textbook version is the bait.
Crypto Jargon
Live numbers load with JavaScript and refresh every few minutes; the text above is the page at build time.