
Doji
Patterns · Candlestick Patterns
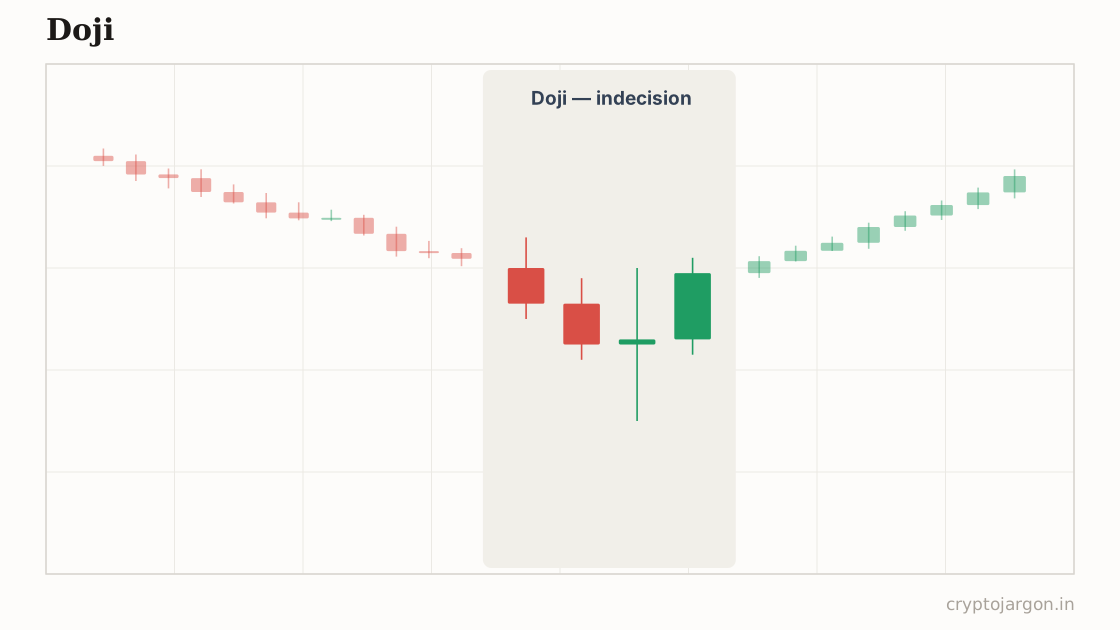
A doji is a candle whose open and close are nearly equal, leaving a tiny body with wicks on either side. It shows a session where neither buyers nor sellers won, and it is supposed to signal indecision — and, when it appears after a strong trend, a possible pause or reversal.
"A doji is the market shrugging, and you can't trade a shrug."
The structure
A candle whose open and close land within a sliver of each other — the body a small fraction of the candle's total range — with wicks on either side. Variants: long-legged (big wicks both ways), dragonfly (long lower wick, close near the high), gravestone (long upper wick, close near the low). Location is everything: a doji after eight straight green 4h candles on SOL is information; the fifteenth doji inside a weekend BTC range is furniture. Most crypto chop is wall-to-wall dojis that mean precisely nothing.
Whose orders make the shape
A doji says the session's aggression cancelled out — either buyers and sellers hit each other with equal force, or nobody showed up at all, and volume tells you which. The interesting one prints at a trend extreme: it's the first candle where the side that's been winning stopped making progress, which can mean their market orders are getting absorbed by someone patient on the other side. The boring one prints mid-range on thin volume, where the shape is just noise wearing a candle.
The conventional trade plan
Convention says you never trade the doji itself — you trade the resolution. Long on a break of the doji's high or short on a break of its low, with invalidation at the opposite extreme of the doji's range, targeting the next support or resistance. After a strong trend, most traders only take the reversal side. That's the standard treatment; the honest version is that a doji mostly tells you to wait one more candle.
The trap — what invalidates it. A doji hands the market two clean trigger levels — its high and its low — and in chop both get poked. The classic retail bleed is the flip-flop: long on the break of the high, stopped, short on the break of the low, stopped, and one candle of indecision just cost you two spreads and two stops. The nastier version sweeps one side to load stops, then drives through the other. What confirms: a decisive close beyond one extreme, on volume, at a level that matters. What tempts: any doji at all while the tape is rangebound and the wicks are noise.
What the evidence says
Doji patterns test out about as close to random as a candlestick can, which makes sense — the definition literally encodes 'this session went nowhere.' Whatever predictive weight shows up in studies comes from where the doji sits, not from the doji. Treat it as a pause button, not a signal.
Tested on our data?
Not this one — it needs a human-drawn line, and a pattern that two traders would draw two different ways can't be backtested honestly. We test the mechanical ones and say so, rather than inventing a number.
Dojis on closed candles, in the scanner
Related
Part of the pattern library — every pattern with its trap, because the textbook version is the bait.
Crypto Jargon
Live numbers load with JavaScript and refresh every few minutes; the text above is the page at build time.