
Three Black Crows
Patterns · Candlestick Patterns
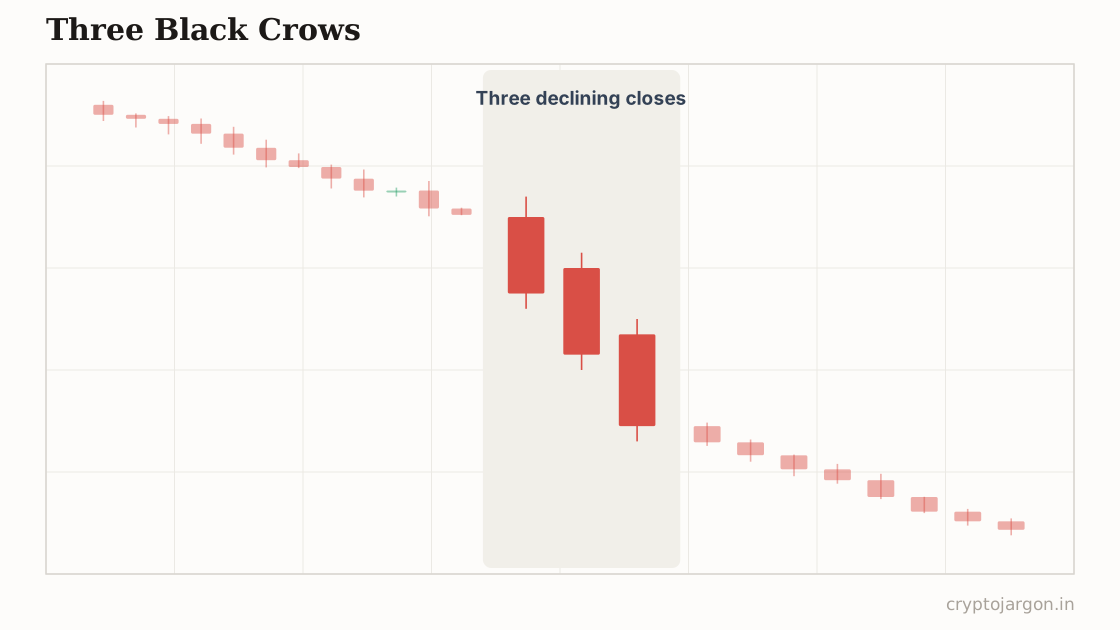
Three black crows is a bearish reversal pattern of three consecutive long red candles, each opening inside the previous body and closing near its own low. Forming after an uptrend or at a stalled high, it is supposed to signal persistent selling pressure and the start of a sustained move down.
"Three red candles marching lower usually means the distribution finished a while ago and you're just now noticing."
The structure
The mirror image of the soldiers: three consecutive long-bodied red candles after an uptrend or at a stalled high, each opening inside the previous candle's body and each closing at or near its own low, with minimal lower wicks. The bodies should be comparable in size — a giant first candle followed by two shrinking ones is a different, weaker story. On a daily BTC chart that's three sessions of persistent distribution; volume that holds or rises across all three reads as conviction rather than a one-off flush.
Whose orders make the shape
Each candle opens with a bounce attempt — dip-buyers stepping in — and each time sellers use that bounce as exit liquidity and press the close to new lows. Closes near the low mean offers are stacked overhead and buyers can't lift price even briefly. Longs from the uptrend bleed in stages: candle one is a dip to buy, candle two is worry, candle three is stop-outs and margin calls doing the selling. In perp markets a liquidation cascade can compress all three acts into a single afternoon.
The conventional trade plan
Same awkward math as its bullish twin: the completed pattern asks you to short after three straight down-candles, often right before a bounce. Convention is to short a weak bounce into the third candle's body rather than the close itself, with invalidation on a close back above the second crow's open — or the pattern high, for the patient. Target is the next real support zone or the run's measured continuation. The invalidation is the point: if price reclaims the bodies, the distribution story is simply wrong.
The trap — what invalidates it. Three red candles is also exactly what a bottom looks like right before it bounces — capitulation and 'three black crows' print the same shape, and retail routinely shorts the third crow straight into the low. The obvious stop sits above the crows, so a sharp squeeze through the bounce zone taps every late short before price decides anything. What confirms: the pattern starting near a high with room below, bounces that stay weak and die inside the prior candle's body, and positioning data showing longs still crowded. What merely tempts: shorting crow number three after the move is stretched and funding has already flipped deeply negative.
What the evidence says
Tested systematically, this pattern's record is as shaky as the rest of the candlestick canon — weak average follow-through, high variance, and heavy dependence on where in the trend it appears. It also frequently marks short-term exhaustion rather than continuation, which is the opposite of the textbook claim.
Tested on our data?
Not this one — it needs a human-drawn line, and a pattern that two traders would draw two different ways can't be backtested honestly. We test the mechanical ones and say so, rather than inventing a number.
Screen by EMA position and MACD for the trend
Related
Part of the pattern library — every pattern with its trap, because the textbook version is the bait.
Crypto Jargon
Live numbers load with JavaScript and refresh every few minutes; the text above is the page at build time.