
Three White Soldiers
Patterns · Candlestick Patterns
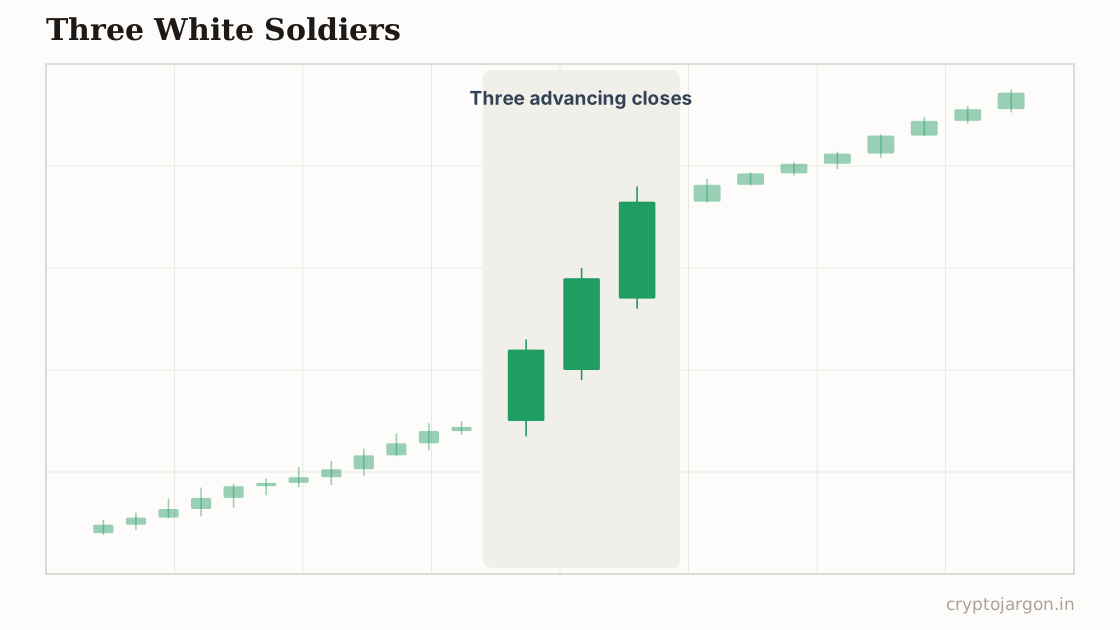
Three white soldiers is a bullish reversal pattern made of three consecutive long green candles, each opening inside the previous candle's body and closing near its own high. It appears after a downtrend or a base and is supposed to signal persistent, committed buying that can kick off a sustained move up.
"Three green candles in a row means the trend just started — or you're about to be its exit liquidity."
The structure
Three consecutive green candles after a decline or a base, each with a long real body, each opening somewhere inside the previous candle's body, and each closing at or near its own high — small upper wicks, if any. The steady staircase matters more than any single candle: roughly similar body sizes, not one monster candle followed by two stubs. On a BTC daily chart that's three sessions of sustained buying; on a 15-minute alt chart it can be one whale's afternoon. Volume ideally holds or builds across the three candles rather than fading.
Whose orders make the shape
Each candle opens with a small pullback — early profit-takers selling into strength — and each time fresh buyers absorb it and push the close to new highs. Three closes near the high in a row means bids are stacked underneath and sellers can't even build a wick. Shorts from the prior downtrend get squeezed in stages: candle one hurts, candle two forces covers, candle three is capitulation buying. The pattern is what persistent accumulation looks like once it stops hiding.
The conventional trade plan
The awkward truth: by the time this pattern completes, you're buying after three straight up-candles. Convention says enter on a pullback into the third candle's body rather than chasing the close, with invalidation below the low of the second soldier — or the first, for the conservative. Target is the next resistance zone or a measured leg equal to the three-candle run. The stop is the genuinely useful part: a close back inside the base says the buying wasn't real.
The trap — what invalidates it. The trap here is exhaustion dressed as strength. Three big green candles at the end of a run — not the start of one — is often the blow-off, with the third candle being retail chasing a move that's already finished. In crypto it gets worse: a thin-book alt can print perfect soldiers from a single buyer marking price up, purely to sell into the FOMO the pattern generates. What confirms: the pattern emerging from a base or downtrend, volume that builds rather than spikes and dies, and pullbacks that hold the prior candle's body. What merely tempts: soldiers appearing after the chart has already gone vertical.
What the evidence says
In systematic tests, patterns like this show weak and unstable edges at best, and this one has a built-in problem: it only completes after a sizeable move has already happened, so much of its historical 'follow-through' is just trend continuing to trend. The clean textbook examples were picked with hindsight.
Tested on our data?
Not this one — it needs a human-drawn line, and a pattern that two traders would draw two different ways can't be backtested honestly. We test the mechanical ones and say so, rather than inventing a number.
Screen by EMA position and MACD for the trend
Related
Part of the pattern library — every pattern with its trap, because the textbook version is the bait.
Crypto Jargon
Live numbers load with JavaScript and refresh every few minutes; the text above is the page at build time.