
Triple Top
Patterns · Reversal Patterns
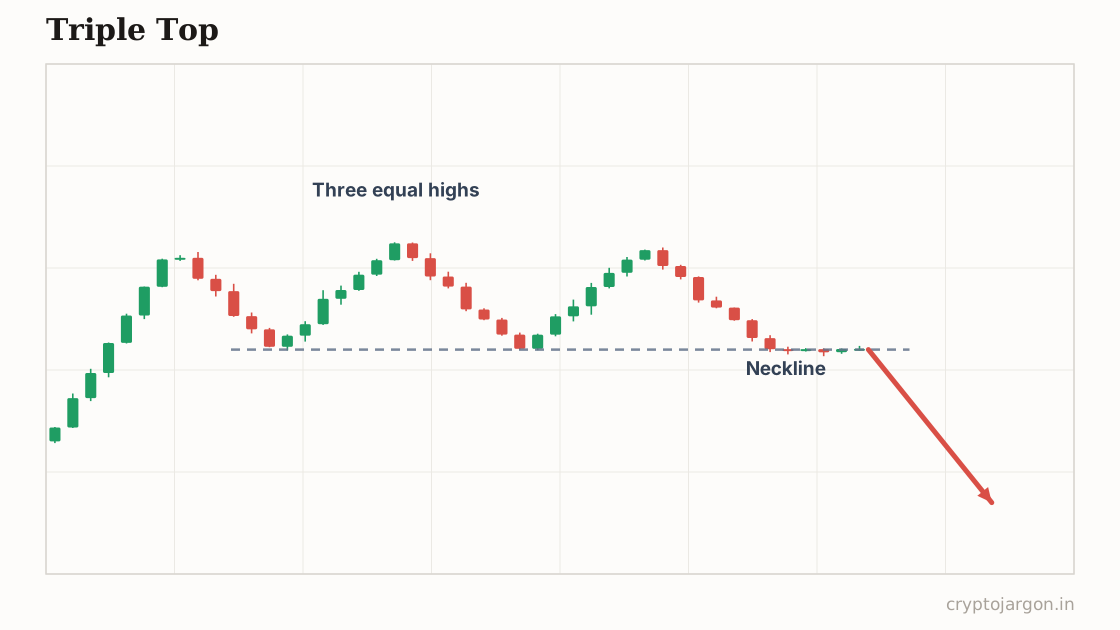
A triple top is a bearish reversal pattern: three peaks at roughly the same level, showing price rejected from the same resistance three times. A close below the support formed by the intervening lows is supposed to confirm the uptrend is exhausted and a deeper move down is starting.
"Three taps on the same ceiling and half the timeline is short — the other half is just waiting to buy their stops off them."
The structure
Three peaks at roughly the same resistance, with two pullback lows between them; the support line across those lows is what has to break for the pattern to complete. The peaks should sit within a couple of percent of each other — if the third one is clearly higher, you're looking at range expansion, not a triple top. Convention says volume shrinks with each successive peak. These take time: on a daily chart a proper triple top can span a couple of months, which is roughly a geological era in crypto.
Whose orders make the shape
Same resistance, three visits, three groups of buyers who bought the touch and got nothing. By the third rejection the chart is crowded: longs from all three pushes holding bags, and shorts who've watched the level hold twice pressing their luck. The stops stack two ways — short stops just above the triple high, long stops below the pattern's support. Whichever cluster gets swept first tells you who was on the wrong side. When the lower support finally breaks, three generations of longs exit through one door, and that's the move.
The conventional trade plan
Convention: short the close below the pattern's support (the line across the two interior lows), or short the retest of that broken support. Invalidation is a reclaim of that support, and any close above the three highs ends the bearish idea entirely. The measured target is the height from the peaks to the support line, projected down from the break. The early entry — shorting the third touch with a stop above the highs — is tighter, but it sits exactly where the squeeze fuel is, so size it accordingly.
The trap — what invalidates it. The dirty secret of triple tops: a level tested three times often breaks up, not down. Each touch consumes some of the sell orders resting at that resistance, while the shorts stacking in at every rejection park their stops just overhead — a squeeze waiting for a spark. So the third touch is simultaneously the textbook short entry and one of the market's favourite trap doors. What confirms the bearish read: rejection at touch three plus a close below the interior lows. What says you're the trap: price pushing through the highs and holding closes above them. A wick above that fails is a gift to shorts; a hold above is a fire alarm.
What the evidence says
Honestly, triple tops are rare enough that systematic evidence on them specifically is thin, and the pattern research that exists doesn't separate them meaningfully from double tops — which already test weak. There's also a live contradiction in technical lore: pattern traders call three touches a top, while level traders say the more a level is tested the weaker it gets. Both can't be right on the same chart. Treat the structure as a map of stops, not a verdict.
Tested on our data?
Not this one — it needs a human-drawn line, and a pattern that two traders would draw two different ways can't be backtested honestly. We test the mechanical ones and say so, rather than inventing a number.
Where forced closes clustered, hour by hour
Related
Part of the pattern library — every pattern with its trap, because the textbook version is the bait.
Crypto Jargon
Live numbers load with JavaScript and refresh every few minutes; the text above is the page at build time.