
Double Top
Patterns · Reversal Patterns
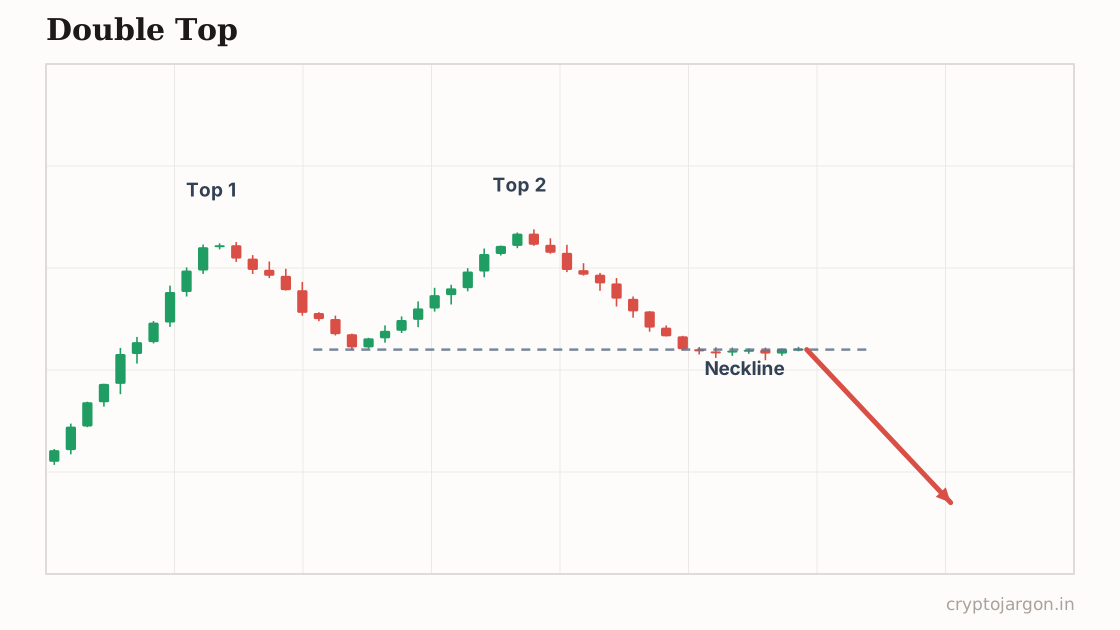
A double top is a bearish reversal pattern: price hits the same resistance twice — two peaks within roughly 2% of each other — with a valley between them. A close below that valley low (the neckline) is supposed to confirm buyers failed twice and a downtrend is likely beginning.
"Price knocked on the same ceiling twice, nobody answered — and the second knock usually wicks a bit higher just to collect the shorts before the drop."
The structure
Two peaks at roughly the same level — call it within a couple of percent — separated by a pullback, with the second peak failing to hold above the first. The low of that pullback is your neckline. Conventionally the second top prints on lighter volume than the first: fewer buyers showed up for the rerun. The 'M' shape only completes when the neckline breaks; two touches of resistance with price still above the valley is just a range, whatever the thumbnail says. You'll find these all over alt charts, because alts spend half their lives rejecting at old highs.
Whose orders make the shape
Top one is where early longs take profit into strength. The bounce convinces dip-buyers the trend is intact, and top two is where they meet the sellers who wished they'd sold top one — supply at the same price, twice. Now the chart holds two groups in pain: longs from the second peak who are underwater immediately, and their stops stacked with everyone else's under the neckline. The neckline break isn't a fresh opinion about value; it's that stop cluster getting eaten and turning into market sell orders.
The conventional trade plan
Convention: short the close below the neckline, or short the retest of the neckline from below. Invalidation is a reclaim of the neckline — and for the aggressive version entered at the second top, a clean break above both highs kills it. The measured target is the height from the peaks to the neckline, projected down from the break. Say your invalidation out loud before entry; this pattern punishes 'I'll just watch it' more than most.
The trap — what invalidates it. Here's the trap the textbooks skip: the second top is often slightly higher than the first — a wick above high one that stops out early shorts and fills breakout longs, then reverses. That's not a failed double top, that's a swept one, and it's frequently a better short signal than the tidy version. The neckline break gets fished too: wick through, collect the stops, reclaim, squeeze. Closes confirm; wicks tempt. If the 'breakdown' can't even hold below the neckline for one candle, you were the liquidity.
What the evidence says
Real talk: tested systematically, double tops show weak and inconsistent results — partly because 'two highs near the same level' happens constantly in any ranging market, so the pattern over-fires. Definitions matter enormously (how close must the peaks be, how deep the valley?) and small changes flip backtest outcomes. The pattern's real value is telling you where the trapped traders and their stops are.
Tested on our data
1,063 instances · 48 coins · 4h candles · 2026-01-24 → 2026-10-01 · detection on closed candles, entry next open, vs a 200-round shuffled control
- Hit rate, ~2 days out (vs random entries)
- 50.5% vs 52.4%
- Hit rate, ~5 days out
- 52.4% vs 53.7%
- Average move in the claimed direction (~2d)
- -0.02%
- Textbook target hit before the stop
- 62.3% of races
- Fakeout rate (break, back inside within 3 bars)
- 41.9%
Statistically indistinguishable from random entries in this window — treat the structure as a map of stops, not a signal.
Open a live chart and mark the old high
Related
Part of the pattern library — every pattern with its trap, because the textbook version is the bait.
Crypto Jargon
Live numbers load with JavaScript and refresh every few minutes; the text above is the page at build time.