
Double Bottom
Patterns · Reversal Patterns
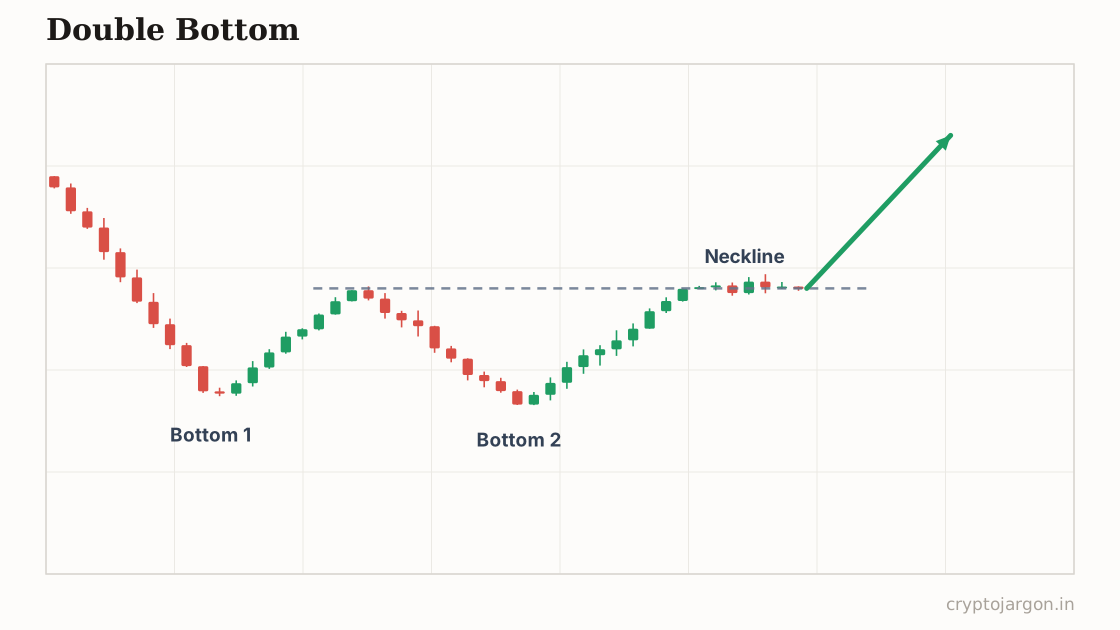
A double bottom is a bullish reversal pattern: price tests the same support twice — two lows within roughly 2% of each other — separated by a bounce. A close above that bounce high (the neckline) is supposed to confirm sellers are exhausted and mark the start of a new uptrend.
"Everyone's grandmother knows the W means up — which is exactly why your stop under the second low is on somebody's shopping list."
The structure
Two lows within roughly a couple of percent of each other, separated by a bounce — the W shape. The bounce high between the lows is the neckline, and the pattern only completes on a close above it. Convention wants the second low on lighter volume, or on a sharp flush that recovers within a candle or two. Watch the second low closely on crypto pairs: very often it isn't a clean retest but an undercut — a wick a fraction below low one that snaps back immediately. That detail is the whole game, and it's covered in the trap section.
Whose orders make the shape
Low one is where the first wave of sellers exhausts and bargain hunters step in. The bounce fails because trapped longs from higher up sell into it. Low two is the decision point: sellers push back to the same shelf, and everyone who bought low one has a stop just underneath it — one of the most predictable stop clusters in trading. If those stops get swept and price snaps back, the forced sellers are done and the book underneath is clean. The rally off a swept second low runs on short covering plus the simple fact that nobody's left to sell.
The conventional trade plan
Textbook entry is the close above the neckline, or the retest of the neckline as support after the break; the aggressive entry is at the second low itself with a stop under it — cheaper, and exactly the position the sweep is designed to shake out. Invalidation: for neckline entries, a close back below the neckline; for the early entry, a decisive close below both lows — not a wick, a close. The measured target is the depth of the W projected up from the neckline; a partial at the retest zone is common practice.
The trap — what invalidates it. This is the pattern the phrase 'double bottom trap' was invented for. Everyone longs the second low, everyone's stop sits under it, and that cluster is a meal: the classic move is a sweep below both lows that stops out the entire W-crowd — and that flush is the real bottom, printed by design. A wick under low two that closes back inside the range is often more bullish than a gentle touch. What confirms: the reclaim close, then the neckline break with real volume. What tempts: buying the second touch just because it's a touch. Don't be the liquidity.
What the evidence says
Straight up: systematic tests of double bottoms show mixed-to-weak results, heavily dependent on how strictly the two lows and the confirmation are defined. The clean Ws in trading course slides were chosen after the fact; live, you can't tell a double bottom from a pause in a downtrend until the neckline breaks — by which point much of the move has often happened. Use it to read where stops sit, not as a promise of reversal.
Tested on our data
927 instances · 48 coins · 4h candles · 2026-01-24 → 2026-10-01 · detection on closed candles, entry next open, vs a 200-round shuffled control
- Hit rate, ~2 days out (vs random entries)
- 47.3% vs 47.5%
- Hit rate, ~5 days out
- 47.5% vs 46.6%
- Average move in the claimed direction (~2d)
- +1.32%
- Textbook target hit before the stop
- 63.9% of races
- Fakeout rate (break, back inside within 3 bars)
- 40.6%
Statistically indistinguishable from random entries in this window — treat the structure as a map of stops, not a signal.
Where forced closes clustered, hour by hour
Related
Part of the pattern library — every pattern with its trap, because the textbook version is the bait.
Crypto Jargon
Live numbers load with JavaScript and refresh every few minutes; the text above is the page at build time.