
Head and Shoulders
Patterns · Reversal Patterns
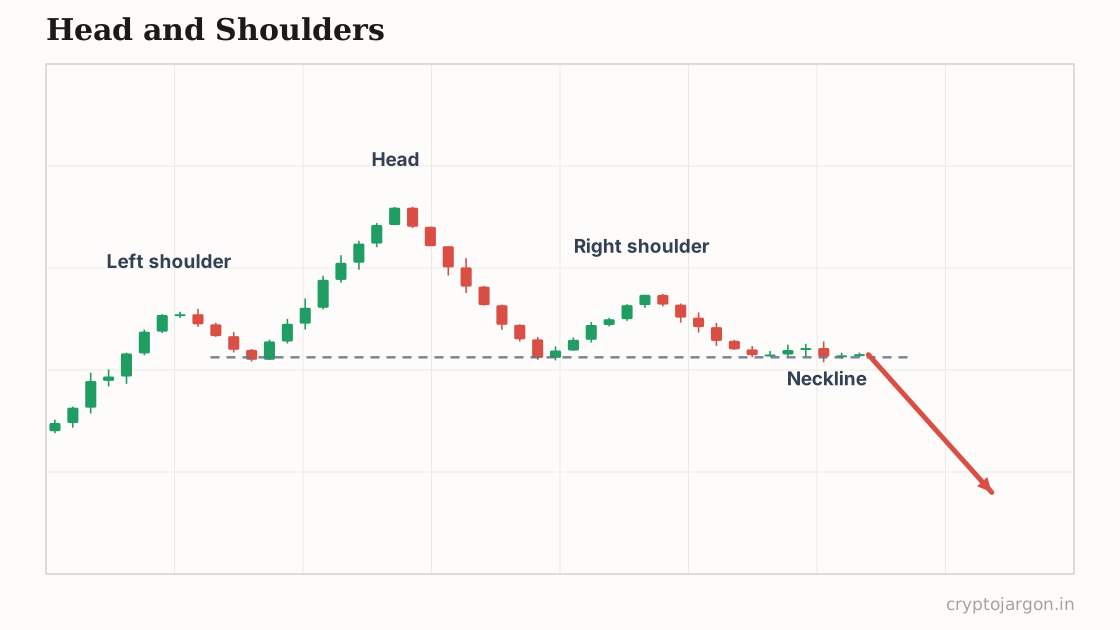
A head and shoulders is a bearish reversal pattern: three peaks where the middle one (the head) is highest, with two lower shoulders either side, joined by a support line called the neckline. A close below the neckline is supposed to signal the uptrend is over and a downtrend is beginning.
"Three pushes up, the middle one was the exit pump, and now everyone's staring at the same neckline waiting for someone else to sell first."
The structure
Three peaks: a left shoulder, a higher head, and a right shoulder that fails to reach the head's high and usually tops out near the left shoulder's level. Draw the neckline across the two swing lows between the peaks — it can be flat or sloped, and where you draw it changes the whole trade, which is part of the problem. Volume conventionally fades through the head and right shoulder: each push up attracts less participation. On BTC you'll see traders draw these on everything from the 15-minute to the weekly; the higher-timeframe versions, built over weeks, are the ones that historically mattered.
Whose orders make the shape
The left shoulder is normal profit-taking in an uptrend. The head is the last real breakout — late longs chase the new high, then it fails, and now they're trapped above. The right shoulder is their exit: the bounce gets sold by trapped longs happy to get out near breakeven, plus early shorts leaning on the head's high. What's left is a market where every rally meets supply, and the only meaningful cluster of orders remaining is long stops parked under the neckline. That's why the break, when it comes, tends to move fast — it's not new selling, it's forced selling.
The conventional trade plan
The textbook play is short on a candle close below the neckline, or wait for the retest of the neckline from underneath and short the rejection — the patient version with a tighter stop. Invalidation is a reclaim of the neckline, or more conservatively a break above the right shoulder's high; if price is back inside the pattern, the pattern's done. The measured target is the height from head to neckline, projected down from the break. That's convention, not promise — treat the target as a take-profit zone, not a destination.
The trap — what invalidates it. Everyone sees the same neckline, which means everyone's stops are in the same pool below it — and pools get fished. The classic sequence: a fast wick through the neckline that fills breakdown shorts and stops out longs, then a reclaim and a squeeze back through the pattern. A wick below the neckline is temptation; a close below it on the timeframe you drew the pattern on, followed by a retest that holds as resistance, is confirmation. If the 'break' happens on thin weekend liquidity with no follow-through, assume the hunt until proven otherwise.
What the evidence says
Honest note: systematic studies of chart patterns find weak and inconsistent edges at best, and head and shoulders is no exception — much of the published support comes from hand-picked textbook examples selected because they worked. Identification is also subjective; two traders will draw two different necklines on the same chart and get two different trades. Treat this as a map of where stops and traps live, not a signal with a proven win rate.
Tested on our data?
Not this one — it needs a human-drawn line, and a pattern that two traders would draw two different ways can't be backtested honestly. We test the mechanical ones and say so, rather than inventing a number.
Open the chart and draw your own neckline
Related
Part of the pattern library — every pattern with its trap, because the textbook version is the bait.
Crypto Jargon
Live numbers load with JavaScript and refresh every few minutes; the text above is the page at build time.