
Inverse Head and Shoulders
Patterns · Reversal Patterns
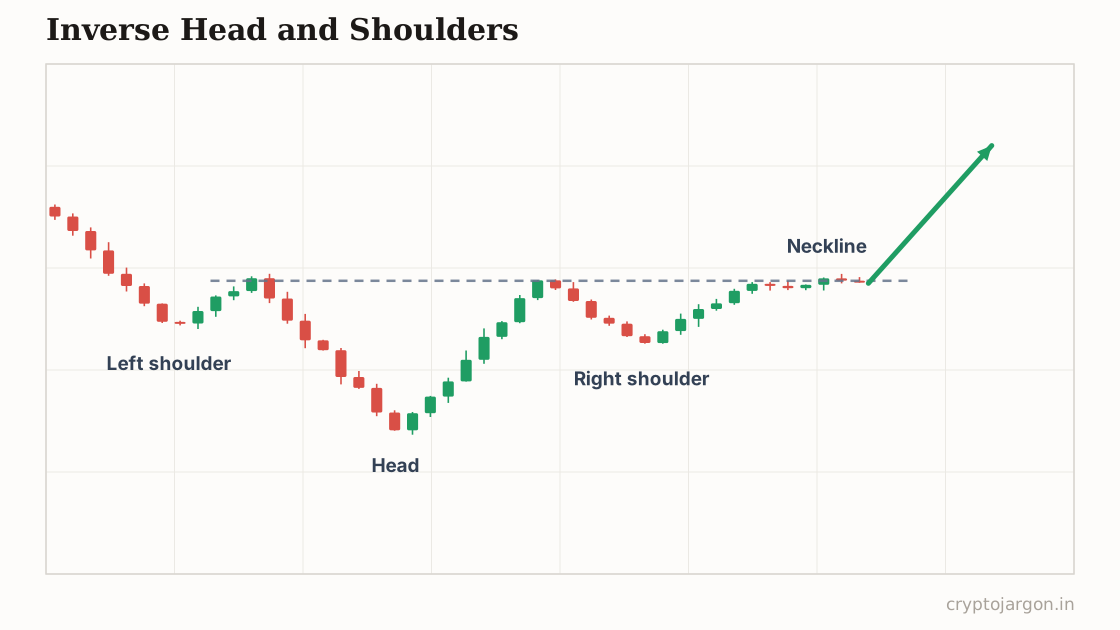
An inverse head and shoulders is a bullish reversal pattern: three troughs where the middle low (the head) is deepest, flanked by two shallower shoulders, capped by a resistance line called the neckline. A close above the neckline is supposed to signal sellers are done and a new uptrend is starting.
"The market dug three holes, kept the middle one deepest, and now the whole timeline is bidding the same neckline like it owes them money."
The structure
Three troughs: a left shoulder, a deeper head, and a right shoulder that holds a higher low than the head — often near the left shoulder's level. The neckline runs across the two bounce highs between the lows, flat or sloped. Conventionally, volume is heaviest into the head (the capitulation flush) and lighter on the right shoulder as sellers exhaust, then expands on the neckline break. Crypto bear-market bottoms get retro-fitted with this pattern constantly — the honest versions take weeks to build on the daily chart, not hours on the 5-minute.
Whose orders make the shape
The head is the flush: stops under the left shoulder's low get run, forced sellers puke, and someone with size is on the other side of that panic. The right shoulder is the tell — price comes back down and sellers can't even reach the old low, because the supply that made it is gone. Shorts who pressed the head are now underwater on the bounce, and their covering stops sit above the neckline, right where breakout buyers also want in. That double demand stacked above one line is what powers the move when it breaks.
The conventional trade plan
Convention says buy the close above the neckline, or wait for the breakout to retest the neckline as support and buy that — a later entry with cleaner invalidation. Invalidation is a close back below the neckline, or for earlier entries inside the pattern, a break under the right shoulder's low; below the head, the whole idea is dead. The measured target is the head-to-neckline height projected up from the break. Book partials on the way — targets are conventions, not appointments.
The trap — what invalidates it. The neckline here is the most crowded buy order on the chart, and crowded breakouts get faded. The standard trap: a push above the neckline that fills every breakout long, then a dump back inside the pattern that stops them all out — a liquidity sweep wearing a bullish costume. A wick above the line tempts; a close above with expanding volume and a retest that holds confirms. Be extra careful when the breakout runs straight into higher-timeframe resistance — that's exactly where the exit liquidity gets collected.
What the evidence says
Being straight with you: systematic pattern testing generally finds little or no reliable edge in bullish reversal patterns once fees, slippage, and the subjectivity of identification are accounted for. The convincing examples you see in threads are survivorship — nobody posts the inverse head and shoulders that broke down. Use the structure to locate stops and demand, not as a probability statement.
Tested on our data?
Not this one — it needs a human-drawn line, and a pattern that two traders would draw two different ways can't be backtested honestly. We test the mechanical ones and say so, rather than inventing a number.
Open a live chart and draw the neckline
Related
Part of the pattern library — every pattern with its trap, because the textbook version is the bait.
Crypto Jargon
Live numbers load with JavaScript and refresh every few minutes; the text above is the page at build time.