
Triple Bottom
Patterns · Reversal Patterns
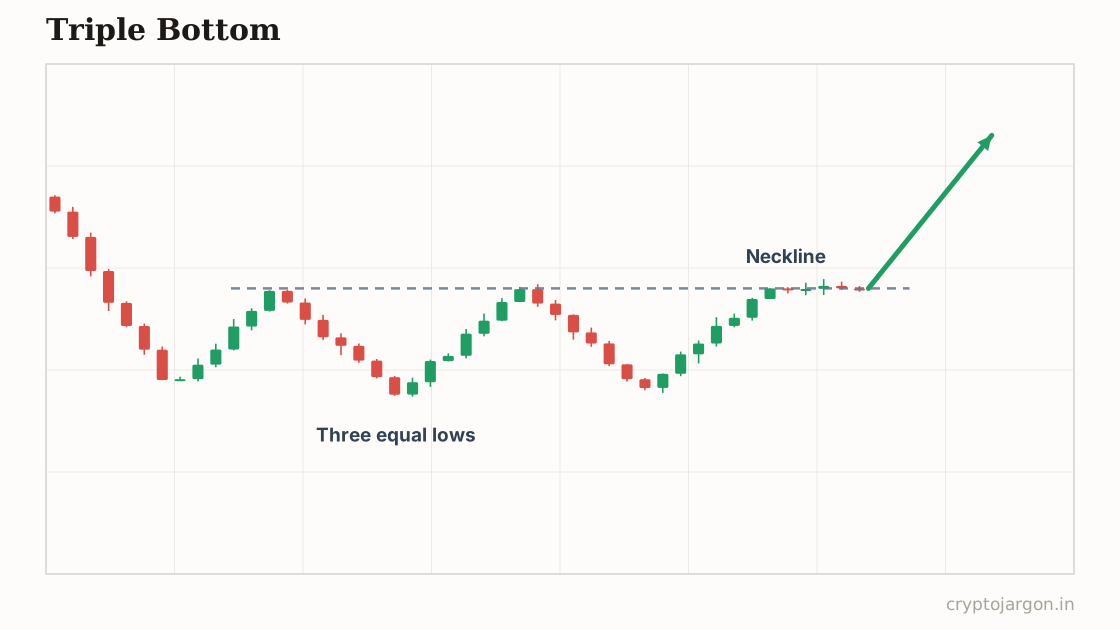
A triple bottom is a bullish reversal pattern: three lows printed at roughly the same support level, each test showing sellers failing to break the floor. A close above the resistance formed by the bounces in between is supposed to confirm accumulation and signal a trend change upward.
"The floor held three times, so naturally everyone's long with stops in the same puddle underneath it — you can guess what happens to puddles."
The structure
Three lows on roughly the same support shelf — within a couple of percent — separated by two bounces, with the resistance across those bounce highs acting as the trigger line. The pattern completes on a close above that line, not on the third touch. Convention wants each successive low on quieter volume, showing sellers losing conviction, and ideally the third low is the shallowest. On crypto majors these tend to form as long grinding bases after a bleed — the kind of chart everyone has stopped talking about by the time it finally resolves.
Whose orders make the shape
Three trips to the same floor means someone has been buying there every time — three tests absorbed without a breakdown reads very differently from a market in freefall. But it cuts both ways: longs now own the level three times over, and their stops sit in one obvious pool under the shelf, while shorts pressing the low a third time have stops above the bounce highs. The pattern resolves when one of those pools gets eaten. A sweep of the lows that instantly recovers means the floor's buyer is still there and just got a discount; a slow grind through on rising volume means the bids are genuinely done.
The conventional trade plan
Convention: buy the close above the resistance line across the two bounce highs, or buy its retest as support after the break. The early version buys the third test of the lows with a stop under the pattern — better price, and precisely the position the stop-run is built to shake. Invalidation: a decisive close below the three lows kills the pattern; for breakout entries, a close back below the trigger line does. The measured target is the base's height projected up from the breakout — and given how long these take to build, treat targets as zones, not pins.
The trap — what invalidates it. Same trap as the double bottom, one level deeper into the crowd's confidence: by the third touch the support is famous, everyone's long against it, and the stop pool underneath is dense. The sweep-then-reclaim below all three lows is the move that hurts the most people — and it's often where the actual low prints. Stay honest about the other outcome too: floors tested repeatedly can simply break, because each test eats the resting bids. Confirms: a swept low that closes back above the shelf, absorption in the order flow, then the trigger-line break. Tempts: blindly bidding touch three because 'triple bottoms don't break'. They do.
What the evidence says
Being blunt: there's no robust systematic evidence that triple bottoms predict reversals — they're rare, subjectively identified, and mostly indistinguishable from an ordinary range until after the fact. The famous examples are famous because they resolved upward; the ones that broke down get relabeled 'support failure' and quietly forgotten. That relabeling habit is why the pattern win-rates quoted around the internet are close to meaningless.
Tested on our data?
Not this one — it needs a human-drawn line, and a pattern that two traders would draw two different ways can't be backtested honestly. We test the mechanical ones and say so, rather than inventing a number.
See what the radar is flagging right now
Related
Part of the pattern library — every pattern with its trap, because the textbook version is the bait.
Crypto Jargon
Live numbers load with JavaScript and refresh every few minutes; the text above is the page at build time.