
Symmetrical Triangle
Patterns · Continuation Patterns
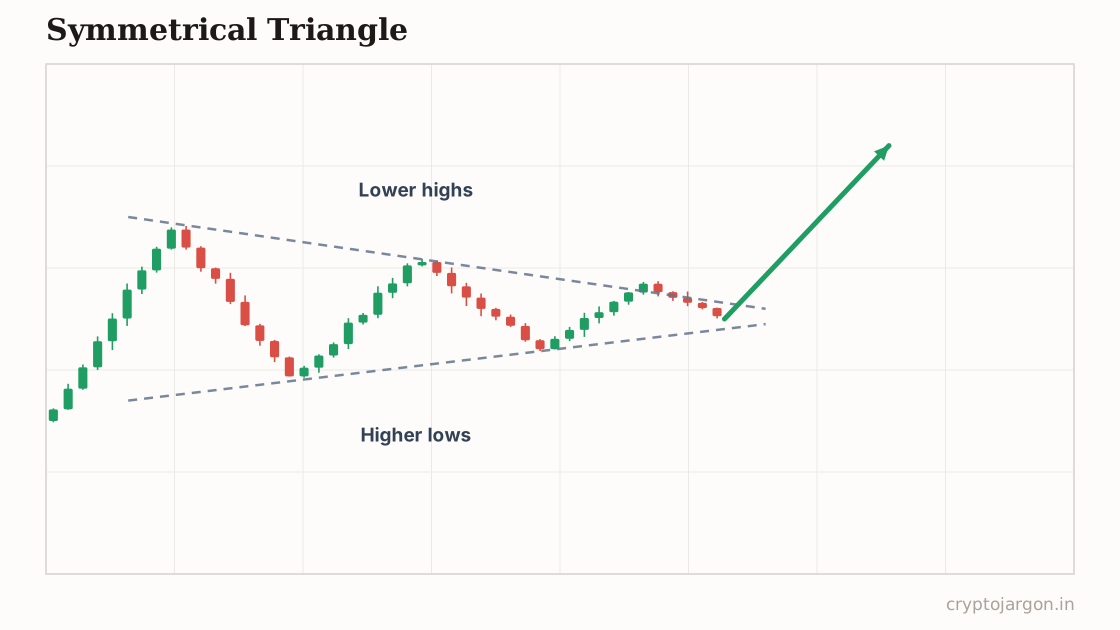
A symmetrical triangle is a consolidation where lower highs and higher lows converge toward an apex as volume dries up. It signals compression, not direction: the conventional read is that price breaks out in the direction of the prior trend, with a target equal to the triangle's widest height.
"The market shrugging with both shoulders — everyone's waiting for everyone else to blink, and the guy with size gets to choose the direction."
The structure
Two converging trendlines with real touches on both: at least two lower highs and two higher lows, each line sloping toward the other at a similar angle. Volume tapers as the range narrows — that contraction is half the pattern. Convention says the meaningful breakout comes somewhere between the middle and about two-thirds of the way to the apex; a break right at the apex, where the range is a few ticks wide, is generally treated as noise rather than signal.
Whose orders make the shape
Neither side has conviction. Sellers lower their offers, buyers raise their bids, and each auction cycle is smaller than the last — compression is literally the order book running out of disagreement. Meanwhile stops accumulate just outside both rails, closer together with every candle. That's the danger: a thin coil with stop clusters on both sides is the cheapest structure on the chart to push around. Whoever commits size first triggers one side's stops and borrows their momentum.
The conventional trade plan
Convention: trade the break in the direction of the prior trend — the pattern is filed under continuation for that reason — with a stop back inside the triangle or beyond the opposite rail as invalidation. Target is the triangle's widest height projected from the breakout point. Plenty of traders plan both sides instead, with orders beyond each rail, and let the market pick; either way the invalidation is the same, back inside the coil.
The trap — what invalidates it. The tighter the coil, the cheaper the fakeout — by the late stages, both stop clusters are a stone's throw from price. The signature trap is the fake-then-break: a push through one rail that runs the stops, snaps back inside, then breaks the other rail and actually travels. That second move tends to go further precisely because the first one refueled it with trapped traders. What confirms: a candle close outside the triangle plus a retest that holds, ideally with volume expanding in the breakout direction. What tempts: anything that happens within spitting distance of the apex.
What the evidence says
Systematic pattern studies treat triangles roughly the same way: the compression is measurable and real, the directional resolution is close to a coin flip once you define the pattern by rules instead of hindsight. The 'breaks in the trend direction' convention performs less reliably in testing than in textbooks. Trade the structure and the stops, not the folklore.
Tested on our data?
Not this one — it needs a human-drawn line, and a pattern that two traders would draw two different ways can't be backtested honestly. We test the mechanical ones and say so, rather than inventing a number.
Watch the coil on the live chart
Related
Part of the pattern library — every pattern with its trap, because the textbook version is the bait.
Crypto Jargon
Live numbers load with JavaScript and refresh every few minutes; the text above is the page at build time.