
Pennant
Patterns · Continuation Patterns
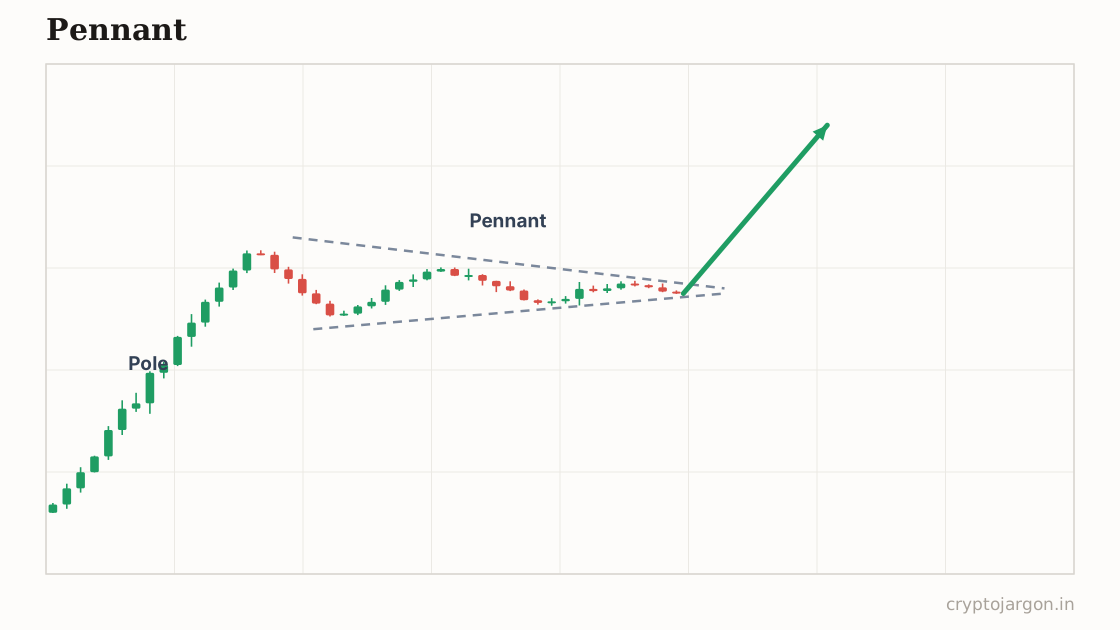
A pennant is a continuation pattern: a sharp move (the pole) followed by a brief consolidation inside small converging trendlines, usually on shrinking volume. It is supposed to signal that the prior trend resumes on the breakout, with the pole's height projected from the breakout as the conventional target.
"A flag that shrank in the wash — same promise, smaller triangle, and a coil this tight gets shoved around for fun."
The structure
Like a flag, it needs a pole: one fast impulsive move. The pause is different — instead of a parallel channel, highs and lows converge into a small triangle, typically just a handful of candles, retracing well under half the pole. Volume contracts into the apex. Size is the tell that separates it from a full symmetrical triangle: a pennant is small relative to its pole and brief relative to the trend. No pole, no pennant — a lone small triangle in chop is just chop.
Whose orders make the shape
The impulsive move leaves both sides unsure. Profit-takers cap the highs, dip-buyers lift the lows, and each round of orders is smaller than the last — that's the converging shape. As the coil tightens, stops build just outside both rails: longs' stops under the lower line, shorts' stops above the upper. Whoever breaks the coil inherits that fuel, which is why the resolution is usually fast — there's very little resting liquidity left inside the pattern itself.
The conventional trade plan
Convention: enter on the break of the pennant in the direction of the pole, stop just beyond the opposite rail — that's your invalidation, because a genuine continuation shouldn't traverse the whole coil against you. Target is the pole's height added to the breakout point. Most traders skip counter-trend breaks entirely: the convention says pennants resolve trendward, so a break against the pole is treated as pattern failure rather than a new signal.
The trap — what invalidates it. Coils this tight get raided both ways. Near the apex the pattern is at its thinnest — it costs almost nothing to shove price through one side, trigger those stops, and reverse. The first break is often exactly that: a stop-run, snap back inside, then the real move through the other rail. That fake-then-break sequence is so common some traders only trade the second break. What confirms: a close outside the pennant with follow-through, or a retest that holds. What tempts: an intrabar poke at the apex on no volume.
What the evidence says
Systematic testing of small consolidation patterns runs into an honest problem: pennants are so short-lived and loosely defined that two researchers rarely agree on the sample. Results across studies are mixed at best. The compression is objectively real — direction of the resolution is far less predictable than the textbooks imply.
Tested on our data?
Not this one — it needs a human-drawn line, and a pattern that two traders would draw two different ways can't be backtested honestly. We test the mechanical ones and say so, rather than inventing a number.
Pull up the chart and draw it yourself
Related
Part of the pattern library — every pattern with its trap, because the textbook version is the bait.
Crypto Jargon
Live numbers load with JavaScript and refresh every few minutes; the text above is the page at build time.