
Bull Flag
Patterns · Continuation Patterns
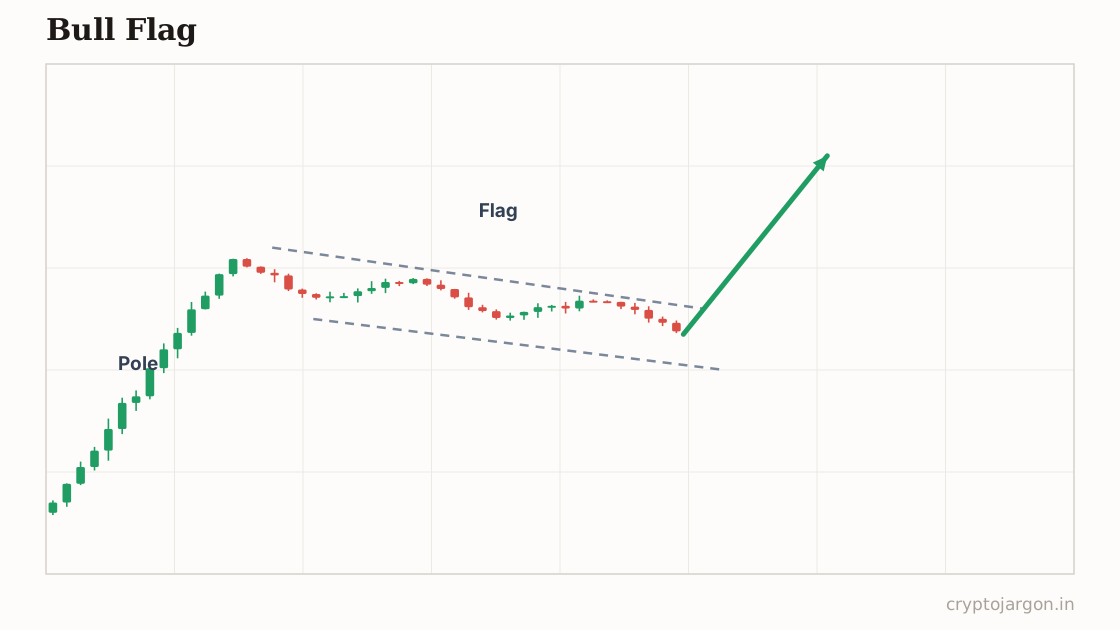
A bull flag is a continuation pattern: a sharp rally (the pole) followed by a shallow, downward-drifting consolidation (the flag) on shrinking volume. It is supposed to signal that the uptrend resumes once price breaks above the flag, with a conventional target of the pole's height projected from the breakout point.
"Price sprints, catches its breath, and the whole market bets on a second sprint — which is exactly why the start line gets raided first."
The structure
Two parts, both measurable. First the pole: a fast, near-vertical rally — think BTC ripping 6-8% in a few hourly candles. Then the flag: a tight, downward-sloping channel that gives back roughly a third to half of the pole, ideally on visibly shrinking volume. A handful of candles to a couple of days on intraday frames. If the 'flag' retraces most of the pole, or grinds sideways for several times longer than the pole took to form, you're looking at a range, not a flag.
Whose orders make the shape
The pole is aggressive market buys plus short covering — someone paid up in a hurry. The flag is early longs booking profit and fade-shorts leaning on the highs, while dip bids quietly absorb underneath. The shrinking volume matters: it says sellers aren't willing to chase price down, they're just taking what's offered. Above the flag high sit two fuel sources — the fade-shorts' stop-losses and a crowd of breakout buy orders. That stacked liquidity is what the resumption move actually feeds on.
The conventional trade plan
Convention: buy the break above the flag's upper boundary (or bid the lower rail if you want a better price and worse odds of a fill), stop below the flag low — that's your invalidation, since a real flag shouldn't lose its lows once the trend resumes. Measured target is the pole's height added to the breakout point. Waiting for a candle close above the flag instead of the first tick through costs you entry price and saves you from a good chunk of fakeouts.
The trap — what invalidates it. Everyone can see the flag high, which means everyone's buy stops and breakout orders sit just above it — a visible pile of liquidity. The classic raid: a push through the flag high that fills the breakout crowd, then a slam back inside the flag that stops them all out. The mirror trap is a quick stab under the flag low to sweep longs' stops right before the real continuation. What confirms: price accepting above the flag and holding it on the retest, with volume and CVD agreeing. What merely tempts: one wick poking through on thin volume.
What the evidence says
Honest bit: systematic tests of flag patterns generally find weak, inconsistent edges, and results swing wildly depending on how you define 'flag' — two traders will draw different ones on the same chart. The textbook examples you've seen were picked because they worked. Treat it as a way to structure risk inside a trend, not a signal with proven odds.
Tested on our data
115 instances · 48 coins · 4h candles · 2026-01-24 → 2026-10-01 · detection on closed candles, entry next open, vs a 200-round shuffled control
- Hit rate, ~2 days out (vs random entries)
- 35.7% vs 47.5%
- Hit rate, ~5 days out
- 42.6% vs 47.7%
- Average move in the claimed direction (~2d)
- -0.65%
- Textbook target hit before the stop
- 41.7% of races
- Fakeout rate (break, back inside within 3 bars)
- 45.2%
In this window it worked LESS often than random entries — the textbook trade underperformed a coin flip.
Coins above their EMAs, in the screener
Related
Part of the pattern library — every pattern with its trap, because the textbook version is the bait.
Crypto Jargon
Live numbers load with JavaScript and refresh every few minutes; the text above is the page at build time.