
Bear Flag
Patterns · Continuation Patterns
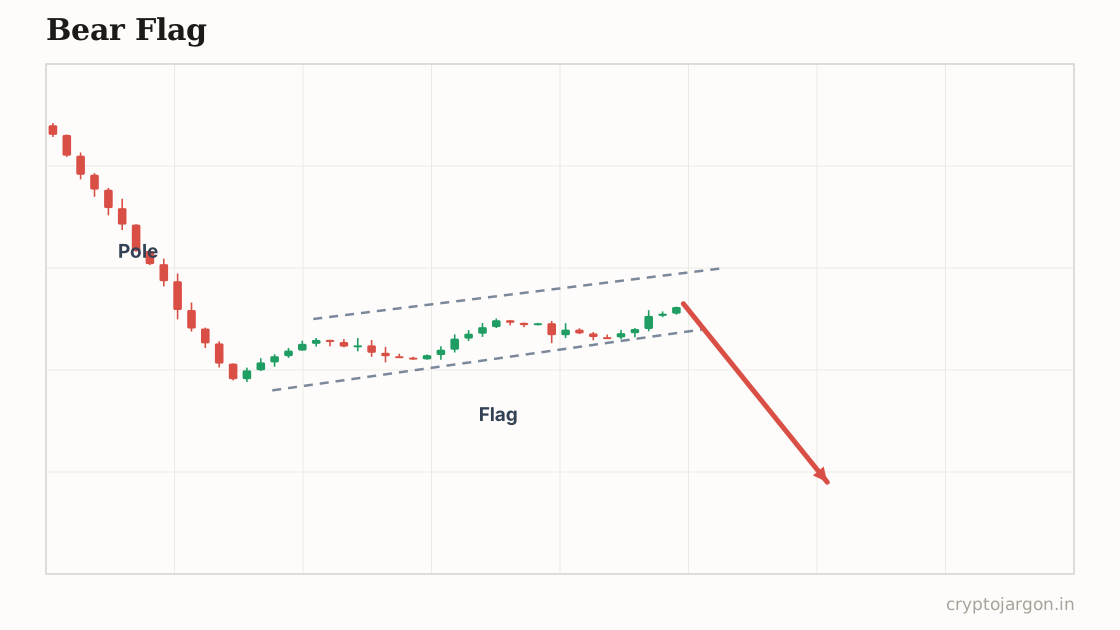
A bear flag is a continuation pattern: a steep sell-off (the pole) followed by a weak upward drift (the flag) on fading volume. It is supposed to signal that the downtrend resumes when price breaks below the flag's low, with a conventional target of the pole's height projected downward from the breakdown.
"That polite little bounce after a dump — the market holding the door open just so it can slam it on the dip buyers."
The structure
A sharp decline forms the pole — often liquidation-driven in crypto, a 10% flush in hours. Then the flag: a low-energy grind upward inside a tight rising channel, recovering roughly a third to half of the pole at most, on clearly fading volume. The bounce should look tired next to the drop — small candles, overlapping, no follow-through. If the recovery reclaims most of the pole or volume expands on the way up, the bear-flag read weakens with every candle.
Whose orders make the shape
The pole is forced selling — stopped longs, liquidations, panic. The drift up isn't real demand: it's shorts booking profit (their buying lifts price), trapped longs praying, and knife-catchers averaging in. Dying volume tells you nobody with size is bidding — price rises on absence of sellers, not presence of buyers. Below the flag low sit the knife-catchers' stops; below those, more liquidation levels. Break the flag and that whole chain becomes sell-side fuel.
The conventional trade plan
Convention: short the break below the flag low, or the retest of the broken flag from underneath if you want confirmation. Invalidation is a close back above the flag high — if the 'weak bounce' makes new local highs, it wasn't weak. Measured target is the pole's height projected down from the breakdown. Partial profit at prior lows is common practice, because in crypto the first support often produces a violent reaction bounce.
The trap — what invalidates it. The flag low is a visible shelf of sell stops from everyone who bought the bounce — so expect the wick through it that triggers them, fills a bigger buyer, and rips back into the flag. That sweep-and-reclaim is the single most common way this pattern burns retail shorts. The other trap runs the opposite way: a pump above the flag high to blow out early shorts right before the actual breakdown. What confirms: acceptance below the flag, with the broken level rejecting the retest and selling volume expanding. What tempts: one low-volume stab into the void.
What the evidence says
Bear flags test about as well as bull flags in systematic studies, which is to say: not convincingly. Definitions are subjective, the clean examples are curated after the fact, and whatever edge exists is small and regime-dependent. The structure is real; the reliability folklore around it isn't.
Tested on our data
205 instances · 48 coins · 4h candles · 2026-01-24 → 2026-10-01 · detection on closed candles, entry next open, vs a 200-round shuffled control
- Hit rate, ~2 days out (vs random entries)
- 52.9% vs 51.6%
- Hit rate, ~5 days out
- 53.2% vs 52.8%
- Average move in the claimed direction (~2d)
- -0.04%
- Textbook target hit before the stop
- 28.8% of races
- Fakeout rate (break, back inside within 3 bars)
- 37.6%
Statistically indistinguishable from random entries in this window — treat the structure as a map of stops, not a signal.
Long and short liquidations, hour by hour
Related
Part of the pattern library — every pattern with its trap, because the textbook version is the bait.
Crypto Jargon
Live numbers load with JavaScript and refresh every few minutes; the text above is the page at build time.