
Ascending Triangle
Patterns · Continuation Patterns
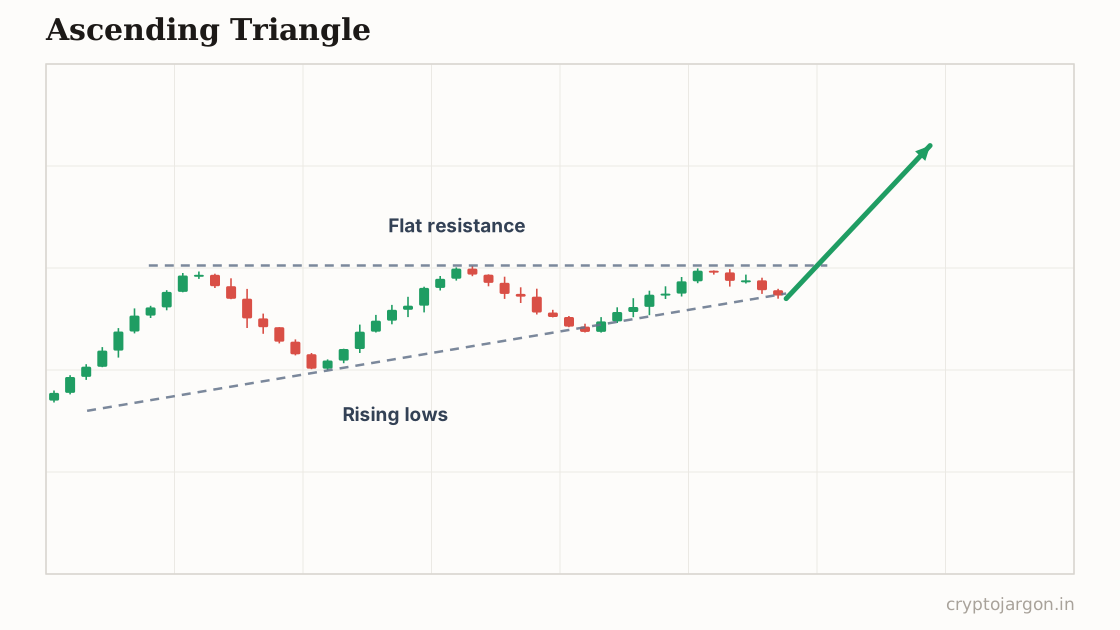
An ascending triangle is a consolidation with a flat resistance ceiling and a rising series of higher lows squeezing price against it. It is conventionally read as bullish: buyers get more aggressive while sellers defend one level, and a breakout above the flat top is supposed to continue the uptrend.
"Buyers keep head-butting the same ceiling — the bet is the ceiling cracks before their skulls do."
The structure
Two lines. The top is flat: at least two or three highs within roughly 1% of each other in crypto terms. The bottom slopes up: each pullback bottoms higher than the last, connectable with a rising trendline. Price gets squeezed into the corner between them while volume typically fades. On a daily chart this plays out over weeks; intraday, over hours. The more touches on the flat top without breaking, the more obvious the level becomes — to everyone, which cuts both ways.
Whose orders make the shape
The flat top is usually one thing: resting sell orders at a fixed price — an exchange wall, someone distributing a position, an unlock seller working an order. The rising lows are the opposite: buyers unwilling to wait for lower prices, bidding each dip earlier. The pattern resolves when the wall is either eaten or pulled. Above the flat top sit breakout buy stops and short stops — fuel. But note who controls the timing: the seller at the wall, not the buyers pushing into it.
The conventional trade plan
Convention: buy the break above the flat top, or the retest of it from above if you'd rather pay for confirmation. Invalidation is a close back below the flat top — a breakout that can't hold the level wasn't one — with a break of the rising trendline killing the setup before any breakout happens. Measured target is the triangle's widest height added to the top. Hedge like always: it's a plan around a level, not a promise about one.
The trap — what invalidates it. The flat top is the single most obvious line on the chart, so the liquidity above it is the most obvious too. The classic raid: pop above the level, fill the breakout crowd and the short stops, then dump back below — breakout buyers become trapped longs whose selling powers the reversal. Also watch the wall itself: spoofed sell walls manufacture this exact pattern to attract buyers before getting pulled. What confirms: acceptance above the level, with the old ceiling holding as support on the retest. What tempts: a single wick or a thirty-second breakout on no volume.
What the evidence says
Testing chart patterns systematically keeps hitting the same wall: identification is subjective, and the clean ascending triangles in textbooks were selected because they broke out. Measured on rule-based definitions, the directional edge is modest and unstable across markets and timeframes. The level is real; the promised resolution is a tendency at best.
Tested on our data?
Not this one — it needs a human-drawn line, and a pattern that two traders would draw two different ways can't be backtested honestly. We test the mechanical ones and say so, rather than inventing a number.
Screen by EMA position and volume for the trend
Related
Part of the pattern library — every pattern with its trap, because the textbook version is the bait.
Crypto Jargon
Live numbers load with JavaScript and refresh every few minutes; the text above is the page at build time.