
Descending Triangle
Patterns · Continuation Patterns
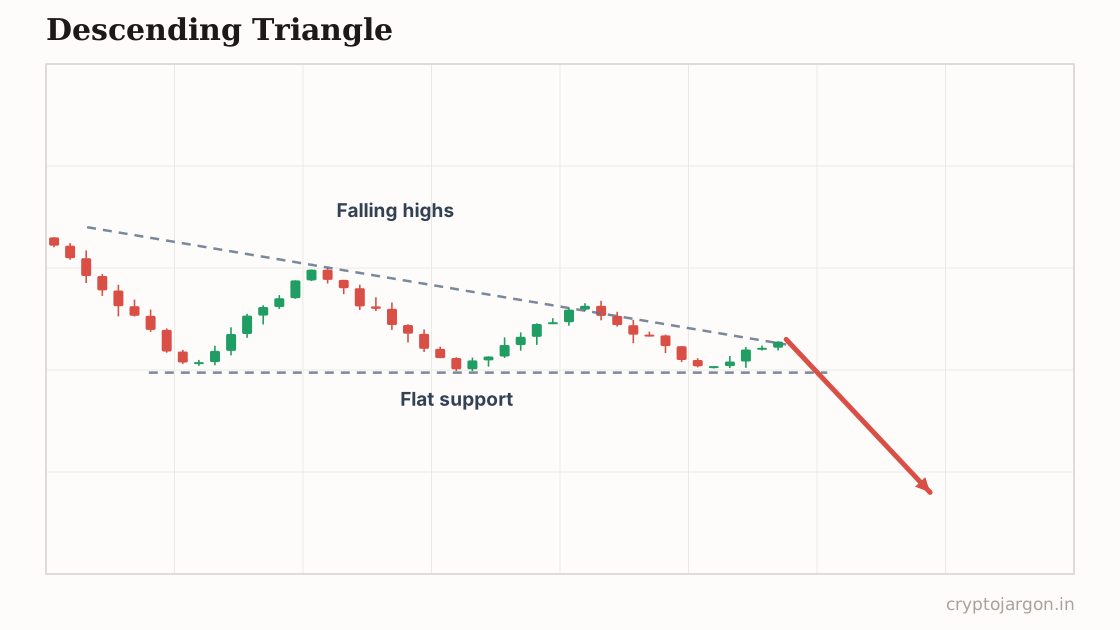
A descending triangle is a consolidation with a flat support floor and a falling series of lower highs pressing down on it. It is conventionally read as bearish: sellers grow more aggressive while buyers defend one level, and a breakdown through the flat floor is supposed to continue the downtrend.
"The floor's been stomped on so many times that everyone downstairs already has a finger on the sell button — and the market knows it."
The structure
Mirror of the ascending triangle. The bottom is flat: multiple lows within about 1% of the same price. The top slopes down: each bounce tops out lower, connectable with a falling trendline. Volume usually contracts as the triangle tightens. You'll see it in crypto after a breakdown, where an old support level keeps catching price while every relief bounce gets sold earlier. Three or more tests of the floor make the pattern textbook — and make the level impossible for anyone to miss.
Whose orders make the shape
The flat floor is a standing bid — someone absorbing at a fixed price. The lower highs are sellers accepting worse fills each bounce: urgency is on the sell side. Below the floor sits a dense cluster of stop-losses from everyone who bought the level, plus liquidation prices from leveraged longs. That's the fuel for the conventional breakdown. But there's a second ending: if the standing bid absorbs everything the sellers have, the pattern fails upward hard, because all those lower-high sellers are now trapped.
The conventional trade plan
Convention: short the breakdown through the flat floor, or the retest of it from below. Invalidation is a close back above the floor — and definitively above the most recent lower high, which breaks the pattern's whole logic. Measured target is the triangle's widest height projected down from the floor. Partials at the first untested level below are standard practice, since breakdown moves in crypto tend to travel fast and snap back faster.
The trap — what invalidates it. Everyone knows where the stops are: just under the flat floor. The sweep-and-reclaim there — a flush through the level that triggers the stop cluster, fills a large buyer, and closes back above — is one of the most common long setups on any crypto desk, which means it's one of the most common ways this pattern traps shorts. A flush that reclaims the floor within a candle or two is not your breakdown; it was someone shopping for your liquidity. What confirms: acceptance below the floor, with the old support rejecting the retest as resistance. What tempts: one wick into the void that immediately gets bought.
What the evidence says
You'll find folklore claiming descending triangles break down some impressive percentage of the time — treat those numbers as chart-lore, not research. Rule-based studies of triangle patterns show murky, sample-dependent results, and the pattern's fame rests on hand-picked examples. What's dependable is the stop cluster under the floor, not the direction of the resolution.
Tested on our data?
Not this one — it needs a human-drawn line, and a pattern that two traders would draw two different ways can't be backtested honestly. We test the mechanical ones and say so, rather than inventing a number.
Long and short liquidations, hour by hour
Related
Part of the pattern library — every pattern with its trap, because the textbook version is the bait.
Crypto Jargon
Live numbers load with JavaScript and refresh every few minutes; the text above is the page at build time.