
Rounding Bottom
Patterns · Reversal Patterns
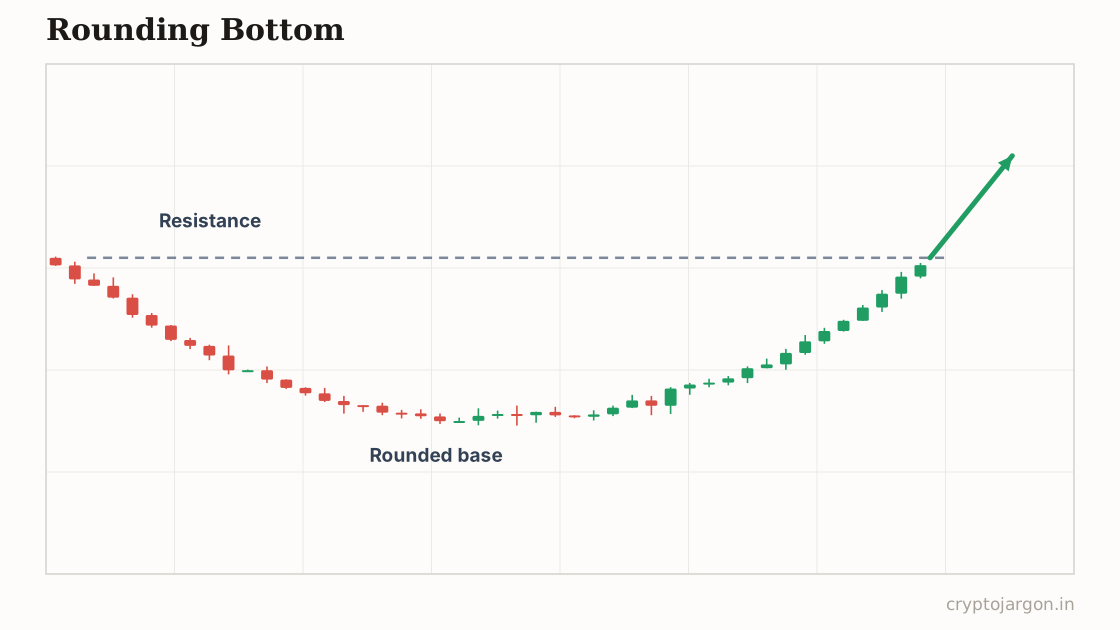
A rounding bottom is a slow bullish reversal pattern: price carves a wide, saucer-shaped base over weeks or months — downtrend flattening, drifting sideways, then curling up. A break above the rim where the decline began is supposed to confirm long accumulation and the start of a new uptrend.
"The most boring chart on your watchlist might be quietly loading a move — or it might just be boring, which is the part the saucer influencers skip."
The structure
A wide, shallow saucer: downtrend momentum fades, price drifts sideways through an apathetic middle, then curls into higher lows on the right side — usually over weeks or months on daily and weekly charts. The 'rim' is the resistance where the decline started, and the pattern completes on a break above it. Volume traditionally mirrors the shape: heavy on the way down, dead through the middle, building on the right side. Post-bear-market crypto charts produce these — long stretches where an alt does nothing while its sellers finish leaving.
Whose orders make the shape
The left side is capitulation and exit; the middle is apathy — the sellers who wanted out are out, and nobody's excited enough to bid it up. That boredom is the point: anyone accumulating size wants to buy without moving price, and a dead saucer middle is exactly what patient absorption looks like on a chart. The right side steepens because remaining supply is thin, so buyers have to pay up. By the time the rim breaks and the pattern is obvious, the position everyone wishes they had was built months earlier, in the boring part.
The conventional trade plan
Convention offers two entries: accumulate the right side's higher lows with invalidation below the base's midpoint, or wait for the rim breakout and buy the close above it (or its retest), with invalidation on a close back inside the base. The measured target is the saucer's depth projected above the rim. These are slow patterns — stops need room, position sizes should respect that, and the trade can take months to resolve or to fail. Nothing about a saucer obliges it to finish.
The trap — what invalidates it. Two traps here. First, the rim is the single most visible line on the chart, so the break gets front-run and faded: a breakout wick that collects every 'finally!' buyer, then a drop back into the range for another month, is standard. A close above the rim with volume, then a retest that holds, confirms; the first green candle through it merely tempts. Second, the hindsight trap: every bottom looks 'rounding' after it resolves, but live, a half-formed saucer is indistinguishable from a consolidation that's about to break down. Trade the levels and the higher lows, not the aesthetic.
What the evidence says
Cards on the table: rounding bottoms are among the least testable patterns — there's no objective definition of a 'saucer', so systematic studies either skip them or fit curves so loosely the results mean little. What evidence exists for slow bases is really evidence about accumulation and trend persistence, not the shape itself. The shape is a story we draw over someone else's buying.
Tested on our data?
Not this one — it needs a human-drawn line, and a pattern that two traders would draw two different ways can't be backtested honestly. We test the mechanical ones and say so, rather than inventing a number.
Pull up the weekly chart and look left
Related
Part of the pattern library — every pattern with its trap, because the textbook version is the bait.
Crypto Jargon
Live numbers load with JavaScript and refresh every few minutes; the text above is the page at build time.