
Rising Wedge
Patterns · Continuation Patterns
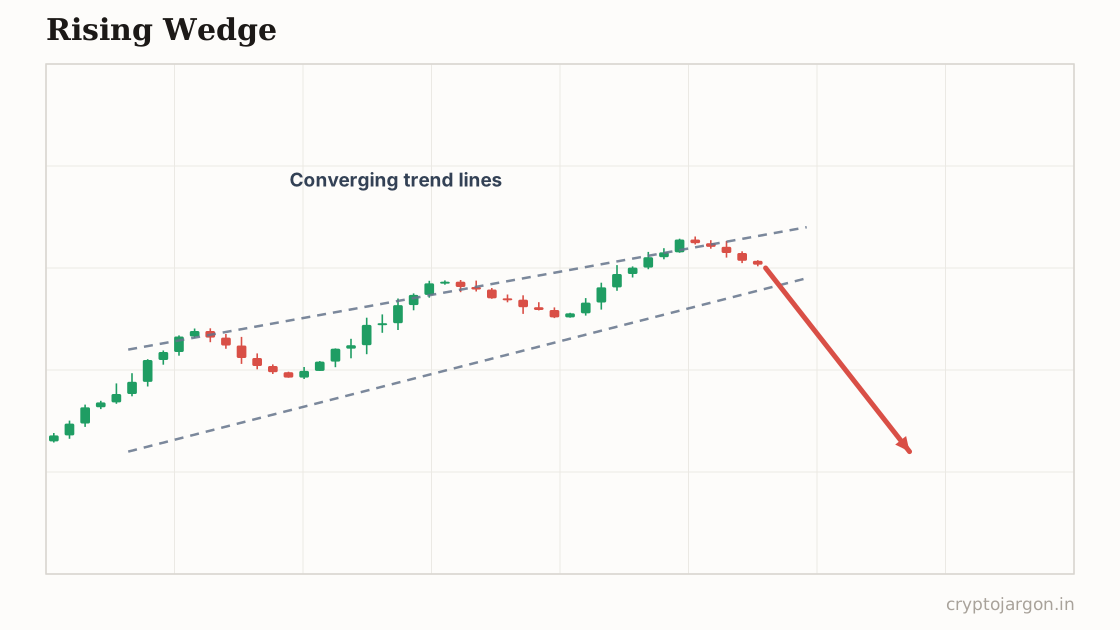
A rising wedge is a pattern where price grinds upward inside two converging, upward-sloping trendlines, with each push gaining less ground on fading volume. It is conventionally read as bearish, momentum exhausting, whether it forms as a rally in a downtrend (continuation) or at the top of an uptrend (reversal).
"Price climbing a ladder that narrows to a point — looks impressive right up until the moment it very much doesn't."
The structure
Both trendlines slope up and converge: highs still rising, lows rising faster, so the range compresses as price climbs. The measurable tell is shrinking progress — each leg up covers less distance than the one before, usually on declining volume. In the continuation version, this is the bear-market bounce: a downtrend, then a grinding, narrowing rally over days or weeks that recovers a chunk of the drop while momentum visibly bleeds out. Overlapping candles and shallow pullbacks that keep making marginal new highs are the signature.
Whose orders make the shape
Buyers are technically in control — price is rising — but each push attracts less follow-through, and the shrinking gains say demand is thinning. In the continuation case it's largely shorts covering and late longs chasing a bounce, not new committed buying. Meanwhile every higher low deposits another stop under the lower trendline, so the exit door gets more crowded as the wedge narrows. When the grind stalls, one push down reaches the whole chain, which is why wedge breaks tend to move faster than the wedge built.
The conventional trade plan
Convention: short the break of the lower trendline, or the retest of it from below. Invalidation is clean acceptance back inside the wedge and above the last swing high — if the 'exhausted' rally keeps making highs that hold, the read was wrong. The conventional target is the wedge's origin, where the pattern began, which in a continuation wedge means a retest of the prior lows. Hedged properly: it's a plan for if the rail breaks, not a prediction that it will.
The trap — what invalidates it. Wedges are notorious for the overthrow: one final push above the upper rail that sucks in breakout longs and stops out early shorts — right before the actual break down. If you short a rising wedge early, that last squeeze is the tax. The lower rail has its own trap: the first crack often gets bought back for a retest, trapping shorts who chased the initial break. What confirms: the lower-rail break followed by a failed retest from below — price tries to get back in and can't. What tempts: the first red candle through the line, shorted at the worst possible price.
What the evidence says
Wedge identification is among the most subjective calls in charting — the same price action gets labeled a wedge, a channel, or a flag depending on who draws the lines. Rule-based tests of wedge patterns show mixed results and no stable directional edge. The exhaustion logic is sound order-flow reasoning; the pattern's track record is not evidence for it.
Tested on our data?
Not this one — it needs a human-drawn line, and a pattern that two traders would draw two different ways can't be backtested honestly. We test the mechanical ones and say so, rather than inventing a number.
Watch momentum roll over on Radar
Related
Part of the pattern library — every pattern with its trap, because the textbook version is the bait.
Crypto Jargon
Live numbers load with JavaScript and refresh every few minutes; the text above is the page at build time.