
Falling Wedge
Patterns · Continuation Patterns
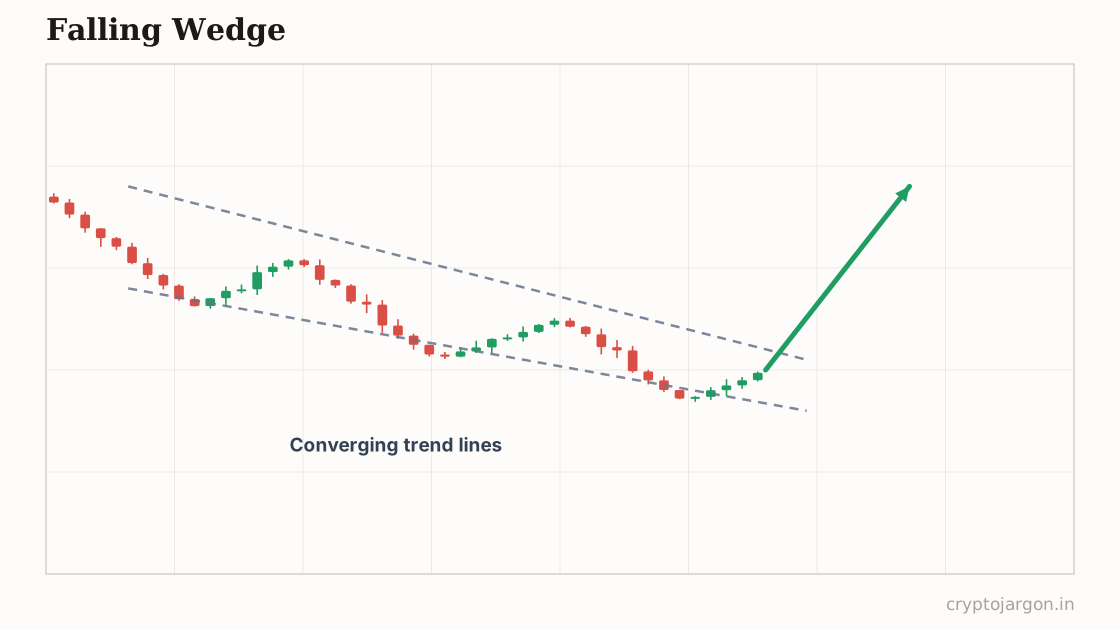
A falling wedge is a pattern where price slides lower inside two converging, downward-sloping trendlines, with each drop losing steam on shrinking volume. It is conventionally read as bullish, selling pressure exhausting, whether it forms as a pullback within an uptrend (continuation) or after an extended decline (reversal).
"Sellers are still winning, but every punch lands softer — the bet is they punch themselves out before you run out of patience."
The structure
Both trendlines slope down and converge: lows still dropping, highs dropping faster, compressing the range as price falls. Each leg down covers less ground than the last, typically on fading volume — the decline is measurably decelerating. The continuation version is the uptrend pullback: after a strong rally, price bleeds lower for days in a narrowing, overlapping grind that retraces a portion of the move without ever accelerating. If the down-legs start expanding instead of shrinking, the wedge read is off the table.
Whose orders make the shape
Sellers keep pressing but each flush finds fewer stops to run and less panic to feed on — the shrinking range says supply is drying up, not that demand arrived yet. In an uptrend pullback it's mostly longs trimming and short-term traders fading, while bigger bids sit lower and let price come to them. Every lower high stacks short stops above the upper rail, so by the time the wedge is tight, the squeeze fuel is loaded. The break, when real, feeds on exactly those stops.
The conventional trade plan
Convention: buy the break of the upper trendline, or the retest of it from above. Invalidation is acceptance back inside the wedge and below the last swing low — a real exhaustion of sellers shouldn't produce fresh lows after the break. The conventional target is the wedge's origin, which for a continuation wedge means a return to the prior highs. Some traders bid the lower rail inside the pattern instead; cheaper entry, but you're buying a falling market on a hunch the knife is slowing.
The trap — what invalidates it. The trap runs downhill first: a final flush through the lower rail that sweeps the stops under every recent low — the capitulation candle — before the actual reversal. Buy the first upper-rail break and you'll also meet the fade: initial breaks often get sold once, trapping early longs before the second, real push. What confirms: a close above the upper rail and a retest that holds it as support, ideally with CVD turning up while price holds flat or better. What tempts: catching the lower rail mid-flush because the wedge 'should' be ending.
What the evidence says
Same honesty as its mirror: wedge boundaries are drawn differently by every chartist, so systematic tests struggle to even agree on the sample, and the results that exist show no dependable edge. The pattern's bullish reputation comes from curated examples. The decelerating-supply logic is worth respecting; the win-rate folklore isn't.
Tested on our data?
Not this one — it needs a human-drawn line, and a pattern that two traders would draw two different ways can't be backtested honestly. We test the mechanical ones and say so, rather than inventing a number.
Draw both falling trendlines on a live chart
Related
Part of the pattern library — every pattern with its trap, because the textbook version is the bait.
Crypto Jargon
Live numbers load with JavaScript and refresh every few minutes; the text above is the page at build time.