
Tweezer Tops and Bottoms
Patterns · Candlestick Patterns
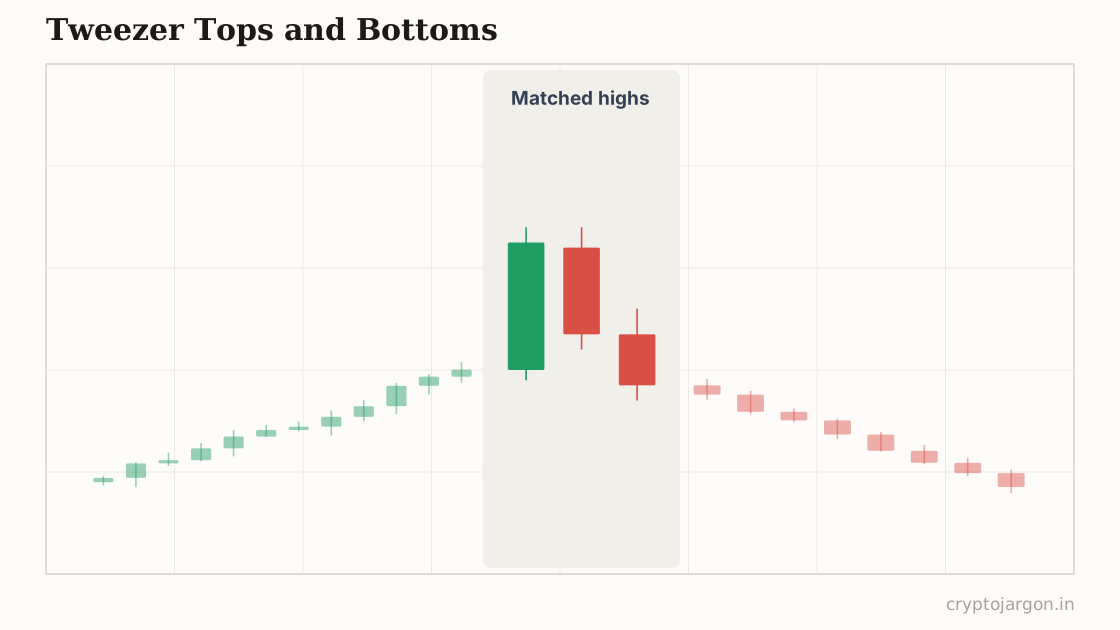
Tweezer tops and bottoms are two-candle reversal patterns where consecutive candles print matching highs (tweezer top) or matching lows (tweezer bottom), usually within a fraction of a percent. The rejection at the same level twice is supposed to signal that price has hit a wall of orders and is ready to reverse.
"Two wicks kissing the same price is the market showing you exactly where everyone's stops are parked."
The structure
Two — sometimes more — consecutive candles whose highs (tweezer top) or lows (tweezer bottom) land at nearly the same price, typically within a few tenths of a percent on majors. The candle colors usually flip: green then red at a top, red then green at a bottom, often with long wicks into the shared level. It's really a compressed double top or bottom — BTC wicking to the same high twice on the 4h is a tweezer top; zoom out and it's often the first act of a range or a failed breakout at resistance.
Whose orders make the shape
Matching extremes are a footprint of resting orders. At a tweezer top, the first candle's high marks where a large seller sits; the second candle rallying into the exact same price and getting rejected tells you the offer is still there, absorbing everything thrown at it. Mirror that for a bottom: a bid that refuses to move. The second wick is usually also a stop-run — price pushes into the stops parked just past the first extreme, those orders fill, and the level holds anyway. Two touches, same price, no follow-through: that's absorption you can see without a footprint chart.
The conventional trade plan
Convention: enter on the close of the second candle, or its next-candle confirmation, in the direction of the rejection — short a tweezer top, long a tweezer bottom. Invalidation is a close beyond the shared extreme; a wick through it is tolerable in crypto, a body closing past it is not. Target is the opposite end of the recent range or the nearest swing level. This is a level trade wearing a candlestick costume, so the level — not the candle shapes — deserves your attention.
The trap — what invalidates it. Here's the uncomfortable part: the double-tap is one of the most farmed setups in crypto. Everyone can see two equal highs, so everyone knows stops sit just above them — which makes a third push through the tweezer level, straight into that liquidity, the more likely event before any reversal. Equal highs and equal lows are liquidity, not walls. What confirms a real tweezer: the rejection holding on the following candles, the level surviving a genuine retest, and ideally a sweep that already happened — wick through, close back inside. What merely tempts: shorting the second touch itself because the wicks look dramatic.
What the evidence says
Two-candle patterns are among the weakest performers whenever candlestick signals get tested systematically — matching highs or lows happen constantly by chance, and plenty of tweezers resolve as continuation, not reversal. Whatever edge exists lives in the level and the context, not the pattern's name. The pretty examples you've seen were chosen because they worked.
Tested on our data?
Not this one — it needs a human-drawn line, and a pattern that two traders would draw two different ways can't be backtested honestly. We test the mechanical ones and say so, rather than inventing a number.
Pull up a live chart and compare the two wicks
Related
Part of the pattern library — every pattern with its trap, because the textbook version is the bait.
Crypto Jargon
Live numbers load with JavaScript and refresh every few minutes; the text above is the page at build time.