
Price Channel
Patterns · Continuation Patterns
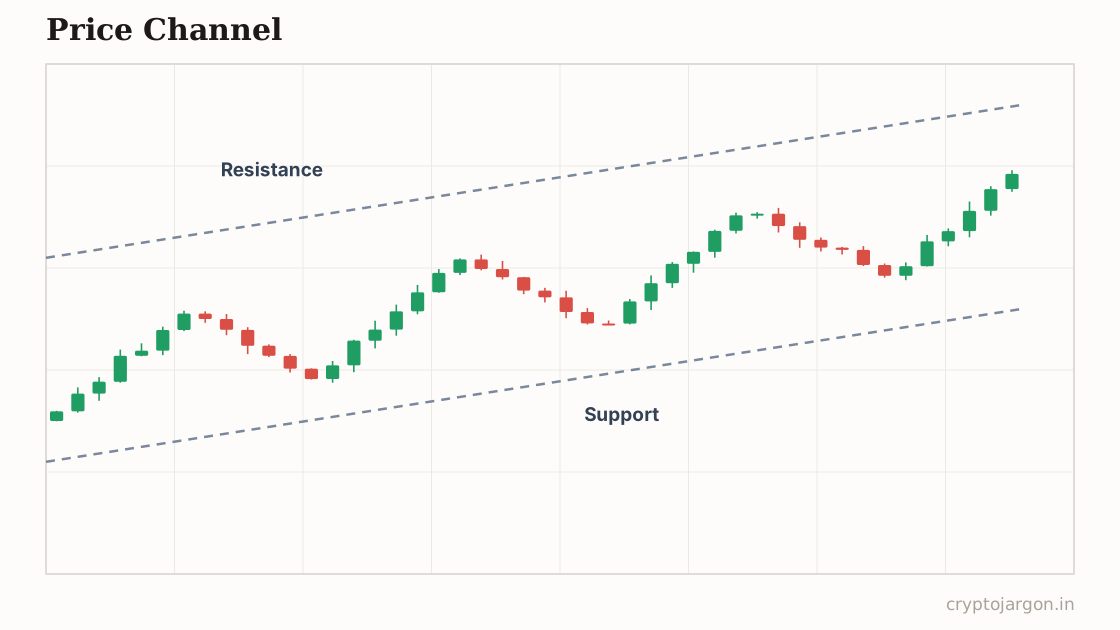
A price channel is a trend contained between two parallel lines: a trendline along the lows and a parallel along the highs. It is supposed to signal an orderly, continuing trend — buy the lower rail, sell the upper in an up-channel — until price breaks a rail and the structure changes.
"Two parallel lines on a chart and suddenly half the market is convinced price owes them a bounce at the bottom one."
The structure
Draw a trendline along at least two swing lows, then a parallel copy along the highs (or start from the highs in a down-channel). A channel is only worth trading once both rails have real touches — two minimum on each, three makes it credible. Rising channels, falling channels, and flat ranges are all the same object at different slopes. Width and slope are measurable, and the midline matters more than most people think: healthy trends hold the upper half of an up-channel, and losing the midline often precedes losing the rail.
Whose orders make the shape
Channels work because they're self-referential. Enough traders see the same rails that bids cluster at the lower one and offers at the upper — the pattern creates the order flow that sustains it. Just beyond each rail sit the stops of everyone leaning on it, which is precisely the liquidity a larger player needs when the crowd's size at the rail isn't enough to fill them. The channel holds until someone needs more than the rail provides; then a rail becomes an exit wound instead of a boundary.
The conventional trade plan
Convention inside an up-channel: buy the lower rail with a stop just beyond it — acceptance beyond the rail you leaned on is the invalidation — and take profit at the upper rail or the midline. For breakouts, the convention is a candle close outside the channel plus a retest, with the channel's width projected from the break as the measured move. Trading with the slope (longs in an up-channel) is standard; fading the upper rail of a rising channel is fighting the trend for the worse half of the range.
The trap — what invalidates it. Rail pokes are the trap. Everyone's stop sits just outside the rail they traded against, so wicks beyond the line that snap back are routine business: a sweep below the channel low that runs the longs' stops before the bounce, or a fake break above the upper rail that reverses into a channel breakdown. The rule of thumb: a wick beyond the rail means someone's stops got filled, a close beyond it means the structure might actually be changing, and only the failed attempt to get back inside confirms it. Everything else is the channel doing what channels do — hunting the edges.
What the evidence says
Rail-bounce trading is mean reversion with a hand-drawn line, and systematic tests of trendline-based strategies are ambiguous at best — results change materially with tiny differences in how the lines are drawn, which tells you how fragile the object is. Channels are a decent map of where orders cluster. As a standalone edge, the evidence is thin.
Tested on our data?
Not this one — it needs a human-drawn line, and a pattern that two traders would draw two different ways can't be backtested honestly. We test the mechanical ones and say so, rather than inventing a number.
Track which rails are holding on Radar
Related
Part of the pattern library — every pattern with its trap, because the textbook version is the bait.
Crypto Jargon
Live numbers load with JavaScript and refresh every few minutes; the text above is the page at build time.